Alleghany
This IPO is on topic here because I do like to look at and talk about alternative asset managers, but also because Alleghany (Y) took a 6.25% stake in ARES last year. With interest rates so low, they were looking for some expertise in the area of fixed income to earn some higher yield. Markel (MKL) too, has recently added some expertise in this area (assigned a full time fixed income manager).
They paid $250 million for their stake, and they own 12.5 million shares (I will ignore the difference between Operating Group Units and Common Units as they are exchangeable 1-1) so that comes to $20/share. ARES was just priced at $19/unit, so the public gets a chance to get into ARES for less than what Y paid for it.
By the way, what valuation did Y pay for ARES? 6.25% stake at $250 million gives a total value of ARES of $4 billion. In 2012, economic net income was $402 million, so that comes to 10x the economic income for the most recent full year (as of July 2013). But in 2013, economic net income fell to $329 million, so $4 billion would be 12x that.
Without getting into too much detail, I think economic net income is the cleanest way to look at these alternative managers. Net income can be messy due to the consolidation of the funds they manage and the GAAP treatment of unrealized gains etc. Distributable income is good too, but that is based on realized gains and incentive fees so can be lumpy. Economic net income will include unrealized gains and losses (that affect incentive fees) as they occur, so reflects more the reality of what is happening in the respective periods.
Anyway, who are these guys?
Background/Co-Founder
I am not a fixed income guy so am not too familiar with ARES, but apparently they are very highly regarded and run a very good operation. The founder is the brother-in-law of Leon Black of Apollo Global Management and was a co-founder of Apollo. ARES is a long time ago spinoff out of Apollo (1997). Despite the reputation of Drexel Burnham Lambert, there have been a lot of good people that have come out of there. Richard Handler who now runs Leucadia is also a Drexel guy. Joel Greenblatt was initially funded by Milken himself.
Here's the blurb about Ressler from the S-1:
Antony P. Ressler. Mr. Ressler is a Co-Founder of Ares and the Chairman and Chief Executive Officer of our general partner. He is a Senior Partner of Ares in the Private Equity Group and serves as Chairman of the Management Committee. Mr. Ressler also serves on the Board of Directors of ARCC. Prior to Ares, Mr. Ressler was a co-founder of Apollo Management, L.P. in 1990 and was a member of the original six-member management team. Mr. Ressler oversaw and led the capital markets activities of Apollo Management, L.P. and Lion Advisors, L.P. from 1990 until 1997, particularly focusing on high yield bonds, leveraged loans and other fixed income assets. Prior to 1990, Mr. Ressler served as a Senior Vice President in the High Yield Bond Department of Drexel Burnham Lambert Inc., with responsibility for the New Issue/Syndicate Desk. Mr. Ressler is also a member of the Board of Directors of Cedars-Sinai Medical Center, is Finance Chair and a member of the Executive Committee of the Los Angeles County Museum of Art (LACMA), and is Founder and Co-Chairman of the Alliance for College Ready Public Schools, a group of eighteen charter high schools and middle schools based in Los Angeles. Mr. Ressler is also one of the founding members of the board and Finance Chair of the Painted Turtle Camp, a southern California based organization (affiliated with Paul Newman's Hole in the Wall Association), which was created to serve children dealing with chronic and life threatening illnesses by creating memorable, old-fashioned camping experiences. Mr. Ressler is also a former member of the board of directors of Air Lease Corporation and WCA Waste Corporation. Mr. Ressler received his B.S.F.S. from Georgetown University's School of Foreign Service and received his M.B.A. from Columbia University's Graduate School of Business.
There are other co-founders and I don't mean to dismiss them as unimportant. But it seems from the ownership and his Chairman/CEO status that he is the main founder:
| Common Units with Voting Power Beneficially Owned(1)(2) | Ares Operating Group Units Beneficially Owned(1)(2)(3) | ||||||||||||||||||||||||
|---|---|---|---|---|---|---|---|---|---|---|---|---|---|---|---|---|---|---|---|---|---|---|---|---|---|
Name of Beneficial Owner
| Number | % Prior to the Offering Transactions | % After the Offering Transactions Assuming the Underwriters' Option is Not Exercised | % After the Offering Transactions Assuming the Underwriters' Option is Exercised in Full | Number | % Prior to the Offering Transactions | % After the Offering Transactions Assuming the Underwriters' Option is Not Exercised | % After the Offering Transactions Assuming the Underwriters' Option is Exercised in Full | |||||||||||||||||
Directors and Named Executive Officers:
| |||||||||||||||||||||||||
Michael J Arougheti
| — | — | — | — | 10,445,613 | 5.22 | % | 4.94 | % | 4.88 | % | ||||||||||||||
David B. Kaplan
| — | — | — | — | 10,445,613 | 5.22 | % | 4.94 | % | 4.88 | % | ||||||||||||||
John H. Kissick
| — | — | — | — | 4,048,812 | 2.02 | % | 1.92 | % | 1.89 | % | ||||||||||||||
Antony P. Ressler
| — | — | — | — | 48,890,390 | 24.45 | % | 23.13 | % | 22.84 | % | ||||||||||||||
Bennett Rosenthal
| — | — | — | — | 10,445,613 | 5.22 | % | 4.94 | % | 4.88 | % | ||||||||||||||
Paul G. Joubert
| — | — | — | — | — | — | — | — | |||||||||||||||||
Michael Lynton
| — | — | — | — | — | — | — | — | |||||||||||||||||
Dr. Judy D. Olian
| — | — | — | — | — | — | — | — | |||||||||||||||||
All directors and executive officers as a group (persons)
| — | — | — | — | 85,444,189 | 42.72 | % | 40.43 | % | 39.92 | % | ||||||||||||||
One nice thing about Ressler is that he is 53 years old. Many of us are Buffett fans and he is not so young. We were also fans of Leucadia, but those founders retired (or nearly retired). Howard Marks is not so young either. So it's kind of a good thing when we look at something and the owner-founder is young and still has a lot of runway.
Some Charts
OK, and here are some of the usual things that show up in S-1's. AUM has been increasing rapidly at ARES, just like at other alternative managers. I have mixed feelings about this, as usual. It's nice to see this kind of growth, and yes, there may be more growth to come.
But on the other hand, how many more years can alternative managers keep growing assets like this? Equity mutual fund managers grew assets at incredible rates too in the 1990's. And the scary thing was that all of the equity managers were growing assets at rapid rates. Is that sustainable? You have two problems with that:
- If they all keep growing AUM at such rates, can there really be that much opportunity for the capital to be deployed?
- If AUM keeps growing at these rates, can they maintain the sort of high rates of return they achieved at smaller AUM levels?
Some of these guys will tell you that it's OK because their asset growth is coming from addition of new strategies; it's not like private equity is building up tons of cash to invest (a lot of AUM growth at the private equity firms are not coming from private equity AUM; they are growing in other areas like hedge funds, fund of funds, credit, real estate etc.)
But then we have to keep in mind that the economies of scale don't work as well when AUM is increased by adding strategies because that often entails hiring (or buying) new teams. The money management model is attractive when you have fixed costs and then just add AUM on top of it so all the incremental fees go right to the bottom line. This doesn't happen when you buy a hedge fund manager or fund of funds company.
But yes, there are other benefits, (cross-marketing, one-stop shop etc.) I suppose. Some synergies might come from one legal department, one human resource dept, shared sales and marketing force, research etc).
Anyway, I digress.
AUM Growth at ARES

| Capital Base | Fee Revenue Base | |
 | 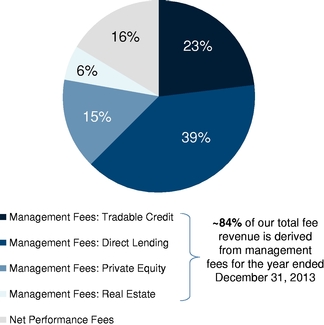 |
The earnings at ARES tends to be stable compared to other alternative managers as 84% of their fee revenue is management fee income. So in that sense, economic net income seems to be a fine thing to look at (as opposed to others more heavily weighted towards private equity where incentive/performance fees tend to be large and lumpy).
Their asset base seems pretty steady too as a lot of the assets are locked up for a long time, including a lot of listed closed end fund assets.
They say:
Stable Earnings Model We believe we have a stable earnings model based on:
• A significant portion of the capital that we manage is long-term in nature. As of December 31, 2013, approximately 58% of our AUM was in funds with a contractual life of seven years or more, including 15% that was in permanent capital vehicles with unlimited duration. This has enabled and continues to enable us to invest assets with a long-term focus over different points in a market cycle, which we believe is an important component in generating attractive returns.
• A significant portion of our revenue is generated from management fees. For the year ended December 31, 2013, approximately 84% of our total fee revenue was comprised of management fees (including 18% attributable to ARCC Part I Fees) and approximately 16% was comprised of performance fees. From 2011 to 2013, management fees averaged 81% (including an average of 18% attributable to ARCC Part I Fees) of our total fee revenue. Management fees, which are generally based on the amount of committed or invested capital in funds we manage, are more predictable and less volatile than performance fees.
• We have a diverse capital base across funds from four distinct groups. For the year ended December 31, 2013, approximately 40% of our total fee revenue was generated by our Direct Lending Group, which includes fees generated by over 25 funds, and approximately 33% of our total fee revenue was generated by our Tradable Credit Group, which manages approximately 75 investment funds. We have a well-balanced and diverse capital base, which we believe is the result of demonstrated expertise across each of our four investment groups.
• A significant portion of our performance fees are linked to credit investment strategies. Over the last three years, a significant portion of our performance fees have been generated by funds with credit investment strategies, which generally generate regular interest income. For the years ended December 31, 2013, 2012 and 2011, 55%, 41% and 40%, respectively, of our net performance fees were from contractual interest payments on debt investments and dividends received by our funds. As a result, we believe that our performance fees are more predictable and less volatile than investment managers predominantly focused on private equity-style investment strategies, in which performance fees are typically based on market gains and losses
Investment Strategies
Here are the four main areas of investing that ARES is involved in.

And here are the targeted net returns of the respective strategies:

(1) Target returns are shown for illustrative purposes only after the effect of any management and performance fees. No assurance can be made that targeted returns will be achieved and actual returns may differ materially. An investment in any of the mandates is subject to the execution of definitive subscription and investment documentation for the applicable funds.
(2) An investment in our common units is not an investment in any of our funds, and the assets and revenues of our funds are not directly available to us. Further, the returns of our funds are not necessarily indicative of Ares Management, L.P.'s operating results or of the price of our common units.
(3) Comprised of investment vehicles with and without leverage.
And the usual thing about the growth of alternative assets as a class:
Increasing Importance of Alternative Assets
Over the past several years, investor groups of all types have meaningfully increased their capital allocations to alternative investment strategies. McKinsey and Co. estimates that alternative investments (which includes private equity, hedge funds and investments in real estate, infrastructure and commodities in a variety of vehicles) grew at a 14% compound annual growth rate versus non-alternative investments at 2% for the six year period from 2005 to 2011. We expect this current trend will continue as the combination of volatile returns in public equities and low-yields on traditional fixed income investments shifts investor focus to the lower correlated and absolute levels of returns offered by alternative assets.
Increasing Demand for Alternative Assets from Retail Investors
Defined contribution pension plans and retail investors are demanding more exposure to alternative investment products to seek differentiated returns as well as to satisfy a desire for current yield due to changing demographics. According to McKinsey & Co., retail alternative investments will account for 13% of U.S. retail fund assets and 24% of revenues by 2015, up from 6% and 13% as of year-end 2010, respectively. ARCC has benefited from this growing demand, increasing its assets under management from approximately $300 million in 2004 to $9.7 billion in 2013. Our Tradable Credit and Real Estate Groups have raised three publicly traded vehicles over the past two years. With an established market presence, we believe we are well positioned to take advantage of the growing opportunity in the retail channel.
The interesting thing here is the growing demand for alternative assets from retail investors. ARES has four listed closed-end funds so already directly runs retail money. This is interesting because Blackstone, Oaktree and others frequently mention the growing retail demand for alternative investments. Oaktree sub-advises mutual funds (as does Blackstone), but they don't have any direct product offering like ARES does. Could this sort of thing be what Oaktree is looking into now?
The following charts present our AUM by channel and our retail and our direct channel by investor, in each case as of December 31, 2013.
| AUM By Channel | AUM By Direct Institutional Channel Direct Channel By Investor Type | |
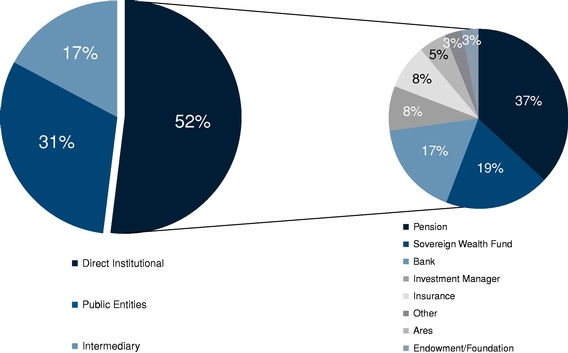 | ||
As of December 31, 2013, 52% of our approximately $74 billion in AUM is from our direct institutional relationships. The majority of these assets are from pension funds, sovereign wealth funds, banks, investment managers and insurance firms. Our top 10 direct institutional investors account for approximately 19% of our AUM, and no such single investor accounts for more than 4% of our total AUM. Our publicly traded entities, including ARCC, ACRE, ARDC and ARMF, account for 31% of our AUM. Ares has over 350 institutional investors and over 200,000 retail investors across our four publicly traded investment vehicles. (emphasis mine)
I will take a quick look at some of these listed closed-end funds later (maybe another post). They do look interesting, particularly for people who are interested in fixed income investments (and I generally am not). How often do we look at an alternative manager and are able to buy into their fund right away?
Performance
Here are some things that show the investment performance of ARES.
Tradable Credit Group:
The following table presents our Tradable Credit Group's gross annualized returns since inception and our Tradable Credit Group's relative index outperformance:

(1) Annualized returns over the same period, net of management fees, were 5.0% for Ares U.S. Bank Loan Aggregate Composite and 8.6% for Ares U.S. High Yield Aggregate Composite.
(2) Annualized returns over the same period, net of management fees, were 13.7% for Ares Multi-Strategy Credit Aggregate Composite and 15.8% for Dedicated Special Situations Funds.
(3) In addition to outperforming the relevant indices on an aggregate basis since inception by the indicated amounts, each of the investment strategies has outperformed the relevant indices on an annual basis in the majority but not all calendar years since inception.
The Tradable Credit Group manages approximately 75 funds across strategies in long-only and alternative credit. No single fund contributed 10% or more of the Tradable Credit Group's 2013 total management fees, whereas over 30 funds contributed over 1% of the group's total management fees. The Tradable Credit Group manages four of our significant funds: ECO I, an alternative credit hedge fund designed as an enhancement to existing fixed income strategies or as an alternative to global equity strategies, AELIS VI, a long-only comingled fund that opportunistically acquired a credit portfolio from a bank in 2008 and is currently in harvest mode, CSF, an alternative credit managed account with a flexible and opportunistic mandate to invest in corporate credit funds, and ASIP II, an alternative credit managed account with a flexible and opportunistic mandate to invest in corporate credit. In addition, the following table includes performance information for the fund with the greatest amount of management fees for the year ended December 31, 2013 for each of the high yield and special situations sub-strategies within the Tradable Credit Group, which are not otherwise represented by the significant funds.
| As of December 31, 2013 | |||||||||||||||||||
|---|---|---|---|---|---|---|---|---|---|---|---|---|---|---|---|---|---|---|---|
| Net Returns (%)(2) | |||||||||||||||||||
Fund
| Year of Inception | Assets Under Management(1) | Since Inception | Past 5 Years | Past 3 Years | Investment Strategy | |||||||||||||
| (Dollars in millions) | |||||||||||||||||||
ECO I(3)(4)
| 2006 | $ | 2,632 | 1.9 | 27.4 | 11.0 | Alternative: Multi-strategy | ||||||||||||
HY II(3)
| 2007 | $ | 369 | 9.0 | 17.2 | 9.0 | Long-only: High yield | ||||||||||||
AELIS VI(5)
| 2008 | $ | 850 | 16.6 | n/a | 15.2 | Long-only: Loans | ||||||||||||
CSF(6)
| 2008 | $ | 1,732 | 14.5 | 15.9 | 9.6 | Alternative: Multi-strategy | ||||||||||||
ICOF I(5)
| 2008 | $ | 236 | 18.3 | 25.4 | 13.6 | Alternative: Special situations | ||||||||||||
ASIP II(3)
| 2009 | $ | 820 | 11.1 | n/a | 7.4 | Alternative: Multi-strategy | ||||||||||||
- (1)
- Assets under management equals the sum of the NAV for such fund, the drawn and undrawn debt (at the fund-level including amounts subject to restrictions) and uncalled committed capital.
- (2)
- Net numbers are after giving effect to management fees and performance fees as applicable. ECO I, AELIS VI, CSF and ICOF I net numbers are also after giving effect to other expenses.
- (3)
- The net return is calculated using the modified Dietz method, which is an estimate of the time-weighted return and adjusts portfolio cash flows according to the time they were invested in the portfolio and is calculated by dividing (A) net asset value change over the period minus cash flow, by (B) (a) beginning net asset value plus (b) weighted cash flow. Net returns are annualized.
- (4)
- From the inception of ECO I through year-end 2008, the fund was managed primarily as a long-only strategy, employing 3-4x debt to equity leverage during a period of high volatility within the credit markets, which impacted fund performance. Beginning in 2009, ECO I's strategy was modified to incorporate a broader array of hedges and other shorting instruments with targeted leverage levels reduced to 1-1.5x on a debt to equity basis. AUM includes capital committed by CSF, a fund of funds.
- (5)
- The net return is an annualized net internal rate of return computed based on cash flows to and from fee-paying limited partners and the partners' ending capital for the period. The past five and three years net returns are calculated using beginning partners' capital for the period.
- (6)
- The net return is an annualized net internal rate of return computed based on cash flows to and from investments and the partners' ending capital for the period. The past five and three years net returns are calculated using beginning partners' capital for the period. CSF is a fund of funds and AUM represented may include AUM that has been committed to other Ares funds.
Our Direct Lending Group has earned accolades such as co-winner of Senior Lender of the Year, Americas in 2013 (Private Debt Investor), 2013 Mid-Market Lender of the Year (M&A Atlas), 2013 Third Place CEO Award for Michael J Arougheti as Chief Executive Officer of ARCC in the Brokers and Asset Managers and Exchanges Category (Institutional Investor All-America Executive Team). Our European team has grown to become a market leader in the region and was named the Specialty Lender of the Year, EMEA in each of 2010, 2011 and 2012 (Real Deals) and the co-winner of the Unitranche Lender of the Year in 2013 (Private Debt Investor). The group has demonstrated a track record of aggregate outperformance, as evidenced by ARCC's performance. The following table presents total shareholder returns of ARCC since its initial public offering in 2004 against certain market indices for the same period:

(1) In addition to outperforming the relevant indices on an aggregate basis since inception, ARCC has outperformed the relevant indices on an aggregate basis for the last five year and seven year time periods. On an annual basis, ARCC has outperformed in five of the ten year-end return periods.
The Direct Lending Group manages over 25 funds in the United States and Europe. While the group manages a range of funds, ARCC and ACE I, each considered a significant fund, combine for over 90% of the group's total management fees for 2013. ARCC is a publicly traded business development company that principally originates and invests in first lien senior secured loans, second lien senior secured loans and mezzanine debt in the United States. ARCC has increased its assets under management from approximately $300 million in 2004 to $9.7 billion in 2013 and is the largest of our funds both by AUM and management fee revenue. ACE I is a 2007 vintage comingled fund focused on direct lending to European middle market companies.
| As of December 31, 2013 | |||||||||||||||||||
|---|---|---|---|---|---|---|---|---|---|---|---|---|---|---|---|---|---|---|---|
| Annualized Returns (%) | |||||||||||||||||||
Fund
| Year of Inception | Assets Under Management(1) | Since Inception | Past 5 Years | Past 3 Years | Investment Strategy | |||||||||||||
| (Dollars in millions) | |||||||||||||||||||
ARCC(2)
| 2004 | $ | 9,658 | 14.1 | 38.4 | 12.3 | U.S. direct lending | ||||||||||||
ACE I(3)
| 2007 | $ | 780 | 3.1 | 5.4 | 7.2 | European direct lending | ||||||||||||
- (1)
- Assets under management equals the sum of the NAV for such fund, the drawn and undrawn debt (at the fund-level including amounts subject to restrictions) and uncalled committed capital but, with respect to ARCC, does not include AUM of the SSLP (through which ARCC co-invests with affiliates of General Electric Company) or Ivy Hill Asset Management, L.P. (a wholly owned portfolio company of ARCC).
- (2)
- The annualized return is the return to ARCC's stockholders based on ARCC's public stock price and is calculated assuming dividends are reinvested at the end of day stock price on the relevant quarterly ex-dividend dates. The return is calculated assuming stockholders did not participate in the rights issuance as of March 20, 2008.
- (3)
- The annualized return is an annualized net internal rate of return computed based on cash flows to and from fee-paying limited partners and the partners' ending capital for the period. The past five and three years net returns are calculated using beginning partners' capital for the period. Includes the period from inception until March 2013, during which ACE I was structured as an operating company and responsible for the costs of its employees and operations. Beginning March 2013, the net annualized return is net of management fees and expenses. Data also reflects the effect of foreign currency fluctuations. AUM includes capital committed by CSF, a fund of funds in the Tradable Credit Group.

ARES has a really good website and a section for their publicly listed investment vehicles. The presentation and reports are very good. Check it out here: www.arespublicfunds.com
Private Equity
Our Private Equity Group has the expertise and mandate to deploy capital in compelling situations across economic environments. This is evidenced by the investment track records of ACOF II and ACOF III, both of which are leading funds in their respective vintages despite deploying capital in vastly different economic environments. The track record of our three fully deployed funds contributed to the successful fundraise of ACOF IV, which raised $4.7 billion, a 30% increase over the predecessor fund. The following table presents gross IRRs since each of the respective funds' inception and certain other data.

(1) Net IRRs over the same period were 14%, 15% and 25% for ACOF I, ACOF II and ACOF III, respectively.
The Private Equity Group manages five comingled funds in private equity. ACOF II, ACOF III and ACOF IV, each considered a significant fund, combine for over 90% of the Private Equity Group's 2013 management fees. Each fund focuses on majority or shared-control investments, principally in under-capitalized companies. Both ACOF II and III are in harvest mode while ACOF IV is in deployment mode. In addition, performance information for ACOF Asia has been included to provide information about the China growth capital sub-strategy within the Private Equity Group.
| As of December 31, 2013 | |||||||||||||||||||
|---|---|---|---|---|---|---|---|---|---|---|---|---|---|---|---|---|---|---|---|
| Net Annualized Returns (%)(2) | |||||||||||||||||||
Fund
| Year of Inception | Assets Under Management(1) | Since Inception | Past 5 Years | Past 3 Years | Investment Strategy | |||||||||||||
| (Dollars in millions) | |||||||||||||||||||
ACOF II(3)
| 2006 | $ | 1,179 | 14.6 | 24.4 | 25.6 | U.S./European flexible capital | ||||||||||||
ACOF III(3)
| 2008 | $ | 3,661 | 24.7 | 25.5 | 17.9 | U.S./European flexible capital | ||||||||||||
ACOF Asia(4)
| 2011 | $ | 229 | n/a | n/a | n/a | China growth capital | ||||||||||||
ACOF IV(4)
| 2012 | $ | 4,646 | n/a | n/a | n/a | U.S./European flexible capital | ||||||||||||
- (1)
- Assets under management equals the sum of the NAV for such fund, the drawn and undrawn debt (at the fund-level including amounts subject to restrictions) and uncalled committed capital.
- (2)
- Net numbers are after giving effect to management fees, the general partner's carried interest and other expenses.
- (3)
- The net annualized return is the internal rate of return computed based on cash flows to and from investments and the partners' ending capital for the period. The past five and three years net return are calculated using beginning partners' capital for such period.
- (4)
- The net return is not shown due to the fund's recent vintage.
Real Estate
In 2013, PERE ranked AREA as a Top 15 real estate manager based on equity raised from January 2008 to April 2013. Additionally, Standard & Poor's ranked our primary and secondary special servicer as above average. The following table presents performance data of our primary strategies:

- (1)
- Annualized realized and unrealized returns over the period since inception net of management fees, the general partner's carried interest and other expenses were 11.0% for the U.S. Value Add strategy and 12.7% for the European Opportunistic strategy.
- (2)
- Represents the dollar weighted average of the unleveraged effective yield of ACRE's principal lending portfolio measured at the end of the seven quarterly periods since inception through December 31, 2013. Unleveraged effective yield is based on the contractual interest rate (adjusted for any deferred loan fees, costs, premium or discount) and assumes no dispositions, early prepayments or defaults and does not take into consideration the impact of leverage utilized by ACRE, fees, expenses and other costs incurred by ACRE or its stockholders, which are expected to be significant. Unleveraged effective yield does not represent net returns to investors of ACRE.
The Real Estate Group manages over 35 funds in real estate debt and real estate equity. Two funds, Euro RE Fund III and ACRE, contributed 10% or more of the Real Estate Group's 2013 management fees whereas over 15 funds contributed over 1%. The Real Estate Group managed one significant fund, EU III, which is a comingled private equity fund focused on real estate assets located in Europe with a focus on the UK, France and Germany. In addition, performance information for two additional funds has been included to provide additional information about the U.S. real estate private equity and real estate debt sub-strategies within the Real Estate Group.
| As of December 31, 2013 | |||||||||||||||||||
|---|---|---|---|---|---|---|---|---|---|---|---|---|---|---|---|---|---|---|---|
| Annualized Returns(2)/ Effective Yield (%) | |||||||||||||||||||
Fund
| Year of Inception | Assets Under Management(1) | Since Inception | Past 5 Years | Past 3 Years | Investment Strategy | |||||||||||||
| (Dollars in millions) | |||||||||||||||||||
EU III(3)
| 2007 | $ | 1,263 | 5.8 | 8.8 | 9.2 | Real estate equity | ||||||||||||
U.S. VII(3)(4)
| 2008 | $ | 803 | 14.1 | 14.1 | 19.9 | Real estate equity | ||||||||||||
ACRE(5)
| 2012 | $ | 1,111 | 6.6 | n/a | n/a | Real estate debt | ||||||||||||
What's it Worth?
OK, so let's just take a quick look at what this thing is worth. Without getting into the details, let's just look at economic net income (ENI). That's what is important here. And next to that I'll put the average fee earning AUM figure so we can come up with a normalized earnings figure.
Average
fee-earning
AUM ENI
2011 $35,947 $193.9
2012 $43,901 $402.4
2013 $53,374 $328.7
(in millions)
I'll use for shares outstanding 211,363,636 which is the figure shown as "Common units outstanding after this offering assuming exchange of all outstanding Ares Operating Group Units for newly issued common units" plus 3,981,363 dilutive restricted shares for a total of 215,344,999. Let's just call that 215 million. There are some potential greenshoe shares and options but I'll leave that out for now.
The shares were just priced at $19/share, that's a $4.1 billion market cap. That's 10.2x 2012 ENI (economic net income) and 12.5x 2013 ENI.
Since ENI went up and down a little in the past three years (did I say that ENI at ARES would be more stable due to high percentage of management fee versus incentive fee?) and we don't know which is a more normal year, 2012 or 2013 (or 2011), we can take an average of the three years.
But an average wouldn't quite work because we see that AUM has been steadily increasing (and not just in the past two years). So we would have to scale the ENI by AUM.
So let's just see what the ENI percentage is versus AUM.
ENI as a percentage of average fee earning AUM
2011 0.54%
2012 0.92%
2013 0.62%
average: 0.69%
There was $59 billion in fee earning AUM at the end of 2013, so assuming that stays the same, the normalized earning power of ARES is $407 million ($59 billion x 0.69%). That means ARES would be trading at 10.1x normalized ENI. Another way to look at it is that ARES has a normalized ENI power per share of around $1.89/unit.
I ignored balance sheet items here as there is only $3.29/unit in tangible equity per share, and accrued incentive fees is actually lower than incentive fee (bonus) payable. And any investment income from investments on the balance sheet is already included in ENI.
Also, since this is a partnership, this ENI figure is pretax; unit holders will have to pay taxes on whatever profits is earned (and flows through to the unit holder whether distributed or not). Since much of the income seems to be from interest income, there will probably be very little that can be treated as long term capital gains.
Why Buy a Fixed Income Manager at the Top of a Bond Bubble?
Of course, we have to think about this. The bond market seems to be at an unsustainably high level. If the bond market turns, won't guys like ARES get hurt? Maybe. But ARES is not PIMCO.
In fact, Alleghany bought into ARES precisely because interest rates were so low and they wanted exposure to some expertise in investing in such a period.
I sort of suspect interest rates can stay low for a lot longer than many people think (like in Japan). If that is the case, then these guys should continue to do well.
If interest rates start to rise because of a stronger economy they should benefit too from more potential deals (same as banks).
Conclusion
Anyway, this is just a quick look at this interesting company. It is run by very good people and is partially owned by Alleghany, a company that I respect. The stock was priced at a level below what Alleghany paid, and it looks like it is priced at around 10x a normalized earnings figure, which is very reasonable.
This 10x multiple doesn't seem to include huge realizations/gains that a lot of other private equity/alternative managers booked last year. Since this is mostly credit, the ENI may be more stable and not bubbled up so much.
Also, ARES funds (including ARCC, the flagship listed vehicle) seems to have done well through the crisis. It is a credit manager and they had their own real life stress test and it looks like they got through it OK with decent performance.
Three years may not be enough to normalize earnings, but again, due to the nature of the business (mostly interest and dividend income versus huge gains on leveraged equity), this may not be too far off.
But I guess we'll know more after the first earnings conference call when we'll start to get more color on the business.
KK,
ReplyDeleteHere is a WSJ article relating to the IPO http://online.wsj.com/news/articles/SB10001424052702303948104579536130795355834
Have you looked at Distribution Now, which is a coming spin off from National Oil Varco? It is in a fragment market and will pursue growth through acquisitions. The future execute Chairman will be the ex-CEO of NOV, who grew the company through M&As and had purchased a dozen distribution companies in the past. A good comparable is probably MRC (but I believe Distribution Now will do a lot more future deals with a very experienced management team).
Hi,
DeleteYeah, I saw the article on ARES.
I haven't looked at DNOW, but it looks interesting. I've been sort of looking at CAM, FLS and CIR which are probably suppliers to DNOW. I'll probably wait until it starts trading and see how it trades. If indexers have to dump it, it would be especially interesting. Thanks for mentioning it.
FYI, from the 2013 Y letter - "Alleghany invested $250 million in Ares and will receive the greater of 6.25% of the manager’s distributed profits or a 5.0% return on our investment" - minimum 5% dividend yield probably skewed their valuation higher
ReplyDeleteGood catch. That's interesting. I forgot about that. I wonder how they structured a minimum dividend like that as it looks like Y owned Operating Group Units, or maybe whatever deal they had was converted into Operating Group Units at yearend.
DeleteEither way, distributable earnings came it at 7.65% for 2013.
I used to own
ReplyDeleteLooks like "direct lending" constitutes a large portion of the fees. That looks to me like nothing more than a kind of BDC business, I could be wrong, but there's no reason that direct lending and some of the other low-margin businesses (credit) and real estate equity and debt (the target returns on real estate equity look high at 12-18%). If we value each part separately, then I don't see the whole being worth 6%+ of AUM. In fact, seeing as their PE operations are tiny, I wonder if that business can ultimately survive.
ReplyDeletethe direct lending is precisely BDC isn't it? i mean their direct lending acquired Allied capital. lol (but apparently at a good price, 5 bucks against 20+ when einhorn shorted it).
DeleteYou're right. As the biggest BDC firm, that could be quite a lucrative business. With the hunger for yield out there, I don't see why the BDC business couldn't double or triple. That's a more interesting business than managing credit or private equity funds.
DeleteHi, managing credit and private equity is pretty lucrative too if they perform. I don't see a difference. I am not a fan of BDC's as an investor, but as a manager, that's pretty sticky money; you don't have to keep fund-raising all the time.
DeleteAs for private equity being small, that can be a good thing too; more opportunities. If you are too big, there aren't as many deals that can absorb the capital.
How well these businesses do will depend on how the funds do. So I don't see an issue, really, with size, other than that these days it can actually be an advantage.
hi there - your articles are excellent - really liked the JPM one. would it be possible to get in touch? thanks, Mark P
ReplyDeleteThanks. I usually do respond to people who post an email address here (and I can delete it after I get it so it doesn't stay out there in cyberspace).
DeleteHi kk
ReplyDeleteLove your blog. Keep it up.
The questions below is not really about ARES, but hope you will give your opinion anyways.
I have read your blog for a long time and find you extremely knowledgeable and wise. Hence I fell there is a very very high possibility that you are beating the stock market long term.(I'm rather confident of that.)
To my question.
I'm thinking of making a stock portfolio of a very large part of my fortune. I can afford to take large loses since my timehorizon is 20-30 years. Not gonna need the Money. I am a buy and hold kind of guy. Bonds seems very stupid as Investment compared to stocks at the moment.
My plan is the following:
Put 50 % in Berkshire Hathaway
16,67 % in Markel Corp.
16,67 % in Liberty Global
16,67 % in Leucadia
I have done extensive research and I feel very comfortable about Berkshire. (See a 10 % + annual return over a 10 year period with a very low risk.)
However the others are probably more risky since I don't know that much about the companies.
Can you comment a bit on each stock in my plan?
Are the stocks wise choices for the long term play?
"We were also fans of Leucadia, but those founders retired (or nearly retired)." Should I worry about this?
(Any of the other Companies where the management is Extremely important long term? I know about the Berkshire situation and Warren and Charlie being old, but I don't see that as being a big problem as others do.)
Any other stocks you can recommend me looking closer at thinking 10 to 20 years ahead?
Hi,
DeleteThanks for the comment. I have written a lot about the above names, except for Liberty Global. I do think they are all very good long term holds, but I can't tell you how to allocate capital between them. BRK is the safest, so it makes sense that that is the biggest position.
Otherwise, I think it just really depends on your own comfort level and how much you understand and are comfortable with the other businesses.
LUK, for example, has a great history but is a very different entity today than two years ago. Half of the business is now an investment bank so if there is another financial crisis, LUK stock can go down a lot even if there is no real permanent value destruction; financials just all tend to go down hard in crisis situations.
So you have to be comfortable with that possibility; don't expect to sell out before a crisis and jump back in.
So more important than what I think is what you think. There is no right portfolio for everyone, I don't think. If I mention a stock and you like it and buy it and the stock goes down 70%, what usually happens is that you kick yourself and say, dammit, why'd I listen to some guy on a blog? etc...
Anyway, whatever you decide to do, visualize a bear market and those stocks going down hard and imagine what it's going to feel like. Would you be comfortable? Would you be able to follow the companies yourself to reconfirm their 'soundness' without having to ask someone if it's still OK to own?
I think those are the things you should think about and if you are comfortable, go ahead and make the investment.
Don't forget, being heavily invested in stocks is a good idea if you have a long horizon and don't need the capital in the near term, but that's what a lot of people said in 2007 too and many of those same people dumped stocks in 2008/2009 and haven't touched stocks since so really think hard about seeing those account statements coming in the mail with big losses because it will happen at some point.
Sorry I can't be much more specific, but I can't really give advice on what people should do; I'm not a financial advisor.
Thanks for reading.
Brooklyn Investor,
ReplyDeleteBy any chance, would you be willing to profile the Capitalize for Kids Investors Conference? We would sincerely appreciate the exposure!
Capitalize for Kids
We operate at the intersection of finance and child health and have a vision of creating a community of professionals that ‘do well by doing good’. Our platform consists of an investors conference, an investment challenge, and a symbolic gift program. In aggregate, these programs have been designed with the goal of raising over $1 million annually for the Hospital for Sick Children, one of the largest and most respected pediatric health-science centers in the world. In our inaugural year, we will be raising capital for the Centre for Brain and Mental Health – an innovative initiative that optimizes the well-being of children with brain disorders, and their families, through the integration of transformative research, clinical care, and education.
About The Conference
The goal of Capitalize for Kids is to bring the investment community together at an annual event centered around great investment ideas and in doing so, provide support for the Hospital. Sophisticated value investors will converge to meet, share ideas, and learn from some of the world’s most successful money managers, many of whom rarely share their ideas publicly.
Our Speakers
• Lee Ainslie III of Maverick Capital
• Steve Shapiro of GoldenTree Asset Management
• Marc Lasry of Avenue Capital
• Larry Robbins of Glenview Capital Management
• Jody LaNasa of Serengeti Asset Management
• Jamie Dinan of York Capital
• Jacob Doft of Highline Capital Management
• Michael Thompson of BHR Capital
• Brian Zied of Charter Bridge Capital
• Jeffrey Smith of Starboard Value
• Evan Vanderveer of Vanshap Capital
• Frank Brosens of Taconic Capital
• Jeff Hales of Alignvest Capital
• Scott Ferguson of Sachem Head Capital Management
• Chuck Akre of Akre Capital
• Guy Gottfried of Rational Capital
• Sahm Adrangi of Kerrisdale Capital
• John Thiessen of Vertex One
What Are We Supporting?
We are committed to raising funds in support of the highest priority needs of the Centre for Brain and Mental Health. An investment in one of the key funding priorities listed below will help ensure that SickKids remains at the forefront of brain health research, learning, and care for the benefit of children everywhere:
• Seed Funding Grant Competition
• Integrative Fellowships
• Knowledge Translation Program
• Neonatal Intensive Care Unit (NICU) MRI Scanner
• Epilepsy Classroom
Hi,
DeleteThanks for posting. This looks like an interesting and worthy project. I am flattered that you think a profile on this blog would provide exposure so thanks for thinking about this blog.
Having said that, this blog is really a simple blog where I just type up what I think and some ideas and I don't want to get involved in profiling events and things like that (except for events that I just happen to go to on my own).
Good luck!
Thank you and completely understand! Keep up the great work - I truly enjoy reading this blog!
DeleteHi Kk,
ReplyDeletemy question is twofold: 1) what is your opinion about Fortress? 2) what is your opinion about 'permanent capital vehicles'?
While for ARES is an important driver of revenue, for Fortress it seems to be in the 7-8% range in the last 3 years and, from a very superficial analysis about one of FIG's vehicles - here http://goo.gl/uUJhve - it seems they have not been a success (for shareholders not the manager ...).
I haven't checked about ARES' vehicles yet but shouldn't we consider them a liquid version of a classic 2.20 hedge fund (or, maybe, more expensive?) and so, when trying to value them, would be better to apply on top a reasonable discount to take into account their embedded fees? Thanks and compliments for your great work on this blog.
Giuseppe
Hi,
DeleteI have been following FIG since it's listing and it is an interesting company and well run. But if you look at the performance figures in private equity, they don't seem to be doing too well compared to the others like CG, BX and APO. And I'm not really a big fan of macro hedge funds and that is one of their main strategies so I have to say FIG is not one of my favorites. They are really cheap, though, and the reason is probably what I just mentioned.
As for ARES listed vehicles, there is a lot of information at the website. They seem to have good track records, and the returns are net of fees so you can make your own decision based on that.
I don't (and never have) invest in fixed income funds at all so don't really have a good feel, but my impression was that these funds may not be bad ideas for people who want to allocate some capital to alternative fixed income.
As far as I know, ARES management is well-regarded, and Y (Alleghany) owns a stake in ARES and ARES will manage a portion of Y's fixed income portfolio, so that's a good thing. Y is very conservative; I don't think they would buy a stake in ARES or have them manage some of their float without having done a lot of work.
Thanks for reading.
Oh yeah, and I forgot to mention that I wouldn't consider ARES listed investment vehicles as liquid versions of classic 2/20 hedge funds. ARES funds are basically credit funds so not at all like a 'typical' hedge fund.
Deletekk
ReplyDeleteam confused about the source of revenue for ARES. Also about the structure. Is it an MLP? Does it act like a general partner for the REIT and BDC and other businesses or does the revenue strictly come from investing funds for others.
ARES is a limited partnership. It's basically an asset manager that manages funds and earns management and incentive fees. It is similar in structure to other alternative asset managers like OAK, BX etc...
DeleteThis comment has been removed by the author.
ReplyDeleteKK,
ReplyDeleteYou probably have read this already.
Jefferies Insight http://www.jefferies.com/CMSFiles/Jefferies.com/files/Insights/FI/JefferiesInsights_April2014.pdf
Thanks. I haven't seen that but I did already read the LUK letter to shareholders. What other part of it did you want to highlight? Their views on rates staying low until late 2015 may help the ARES case as expertise is needed to earn higher yields in this extended low rate environment, and the high percentage of floating rate debt in some structures may be interesting for folks worried about rising rates.
DeleteThanks for commenting.
Hi kk,
ReplyDeleteI am a big fan for your work, I rank it as the among the top literature on value investing. I had a question about Mr. Buffet and didn't know who else to ask. After reading your blog I came to understand that Buffet relishes independence. My question is, how does he find his stocks? Is it through:
1. Casually going through the names of stocks in the main stream media that might be mispriced;
2. value screens;
3. reading the annual reports of large cap stocks; or
4. all of the above.
Lets say he reads the annual reports, does he then follow the stocks performance through a watchlist waiting for a bargain to present itself?
I think the essence of my question is clearer now. I wanted to know how Buffet finds his ideas and keeps track of them. Answering this question would really be helpful!
Hi,
DeleteProbably all of the above, but these days, he probably doesn't do too much. Why? Because at his size, there are only 50 or 100 companies that are big enough for him to be able to buy meaningful amounts in. And you can be sure that he has been reading the annual reports for these companies every single year for decades. I bet the list is far larger than 100 names, but his investment candidates are going to be the largest cap stocks.
So he is very familiar with most companies that would move the needle at BRK (in terms of stock purchases; I'm not talking about buying whole businesses). So it then just becomes a matter of these things trading at a low enough price. I'm sure Buffett keeps an eye on all the big cap names, but surely his brokers and others will alert him if something gets really cheap.
As for how he used to look for stuff when he was far smaller, he has said that he just reads everything, from annual reports, to magazines, newspapers, trade magazines etc.
He has said many times that he went through the Moody's handbook one company at a time (more than once). Today's version would be going through Value Line one page at a time, looking at the price, fundamentals, valuation etc...
At the end of the day, it's just a lot of reading and digging and there are many ways to do that now with all this stuff online.
He has said, in response to a similar question, that he gets good information and ideas just from reading the Wall Street Journal, New York Times, Fortune magazine etc...
Anyway, those are just some things that come to mind that I remember Buffett saying over the years (when people asked him similar questions in the past).
Oh yeah, and I do remember him saying that he would use screens to look for ideas; EV/EBITDA, low P/E etc... He said that's what he would do if he had to look for ideas, but as I said before, he said he can't do that now because whatever comes up on the screen would probably be too small for him to buy for BRK, and the stocks that he can buy, he knows them well enough a screen wouldn't be necessary...
DeleteHi kk,
ReplyDeleteThanks alot for the detailed response! It is very helpful.
Regards,
Ahmed
any comments on ARES 1Q14 cc?
ReplyDeleteHi,
DeleteNot really. No surprises or anything. It does look like they are ramping up for growth and that's a good thing. Expenses are up a bit but we'll see how revenues ramp up going forward.
actually, the pro-forma results look like this company is doing well and making money. The PE is low and compared to the market very low.
ReplyDeleteif they institute a nice dividend this fall or winter, and continue to have good results it could be a nice stock to be in. I picked up a small amount around 18.36. Will buy more in a couple months.
Hi,
DeleteYes, the interesting thing about ARES is that as they say, most of their income is from management fees and not incentive income so their low p/e might be more "robust" or "real" than other private equity entities (including OAK) that had massive realizations (and unrealized) which may or may not be normal when the S&P 500 index went up 30%.
So in that sense, ARES might be cheaper than the other ones that had a great 2013.
I can't tell you how much I enjoy and look forward to your posts Brooklyn. Thank you. I would love to read in a blog post or a comment if you have any updated thoughts on GLRE and TPRE.
ReplyDeleteThanks. I don't have much new to say about GLRE and TPRE, but maybe I'll make an update. But both of them have really good presentations on their website. You can even listen to the GLRE investor day presentation audio file available at the GLRE website.
DeleteThe story is simple and is still the same.
Thanks for reading.
KK - have you looked at AP Alternative Assets (AAA)?
ReplyDeleteAAA is run by Apollo. AAA's main asset is Aviva and other annuities business.
Hi,
DeleteI've looked at that in the past and it is an interesting vehicle, but now it's just one asset, right? And it seems to be trading above NAV so I don't know what the story is here. This is not to say there isn't one. I don't know. I'm generally not a big fan of life insurance/annuity businesses.
Can you share your general thoughts on the life insurance / annuity business? What aspects of it makes you not a big fan?
DeleteThanks
I actually don't know too much about it so this is just my personal bias. First of all, I don't tend to like broker-driven high-fee businesses, and that's what I think annuities are. I do tend to think they are rip-offs with high fees and low returns for buyers. Yes, that's what they say about hedge funds and mutual funds too, but annuities I think is even more so. So it's hard to support a business where I don't even like the end product too much. Plus, I don't know what the moat there is either as I never really heard of annuities that do well or that don't do well. In mutual funds, we know who the good managers are etc... But in annuities? I don't think it's performance driven. I tend to think it's driven by brokers generating fees thanks to the ignorance of their clients. Not such a wonderful model.
DeleteAs for life insurance, again, where is the moat? Yes, credit rating and reputation matters But otherwise, I don't really understand the dynamics of competitive advantage. It seems like a straightforward thing with little room for 'edge'. For example, in P&C or reinsurance, there are companies that underwrite well and those that don't. There are those that manage assets well and others that just do OK. Some do both really well, others do underwriting really well but just own bonds.
So there is a lot of 'color' in the business and you can make judgements about them.
For life insurance, to me, it just all seems very blah to me and I have no idea about these factors. How can you create an edge in that business? I don't know.
It doesn't mean it's a bad business, of course.
anyone know why ARES has been so beaten up lately? Has anything really changed?
ReplyDeleteJust wondering if you had any updated thoughts on Ares since the IPO? You mentioned you would want to follow the earnings call -- anything of note there? I do see Ares has been beaten up like many of the other alternative managers. Thanks
ReplyDeleteNo new insights, particularly. These alternative managers are all just getting killed. I am not as familiar with BDC's and credit products. There are a lot of things going on in the industry right now so maybe a basket of these will outperform over time. Despite a flat/unchanged stock market, there is really a lot of damage occuring beneath the surface, so it's a scary time.
Delete