Friday, June 19, 2015

Brookfield Asset Management (BAM)

This name has been mentioned on this blog a few times in the comments section, but I never wrote about it.  It is well known in the value investing community and I said I'll make a post about it in the near future so here it is.

First of all, BAM is sort of an outsider/owner-proprietor business as it has been run for a long time by a single CEO, and the great track record is attributed to him.

Story Fits Too Much
The only thing that I am not so excited about in recent years is that the story sort of fits the environment a little but too much; pension funds and others need to increase returns to be able to make obligations, with interest rates low and stock market scary people need alternative investments.  With the perception of higher risk (or high cost, low return) of hedge funds and private equity funds, fear of future inflation due to global perpetual pump-priming (global PPP?), hard or real assets and real asset managers look really, really interesting.

Oftentimes, when everything is just too perfect, the investment doesn't pan out.  So that's what I've sort of been worried about.  Plus, honestly, I've never really been a big fan of commercial real estate.  There have been some great wealth created in real estate for sure, and it's a solid investment if you have good people investing.  But it's just never been something that excited me.  Don't tell Ackman I said that, though...

Lou Simpson's Concentrated Bet
What's really interesting is that Lou Simpson bumped up his bet on BAM this year.  Lou Simpson probably needs no introduction here, but just in case, he's a portfolio manager that managed GEICO's investments for many years with great results (I think beating Buffett).  He now runs SQ Advisors, after retiring from GEICO.

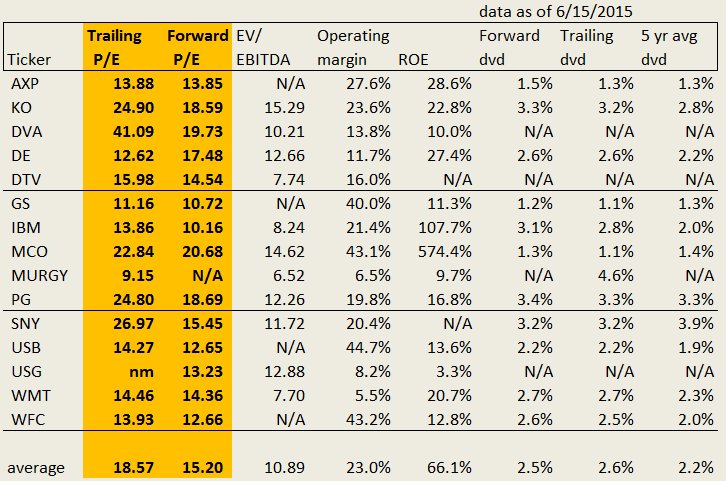
Just as a reminder, here is Simpson's investment performance at GEICO from BRK's 2004 annual report:


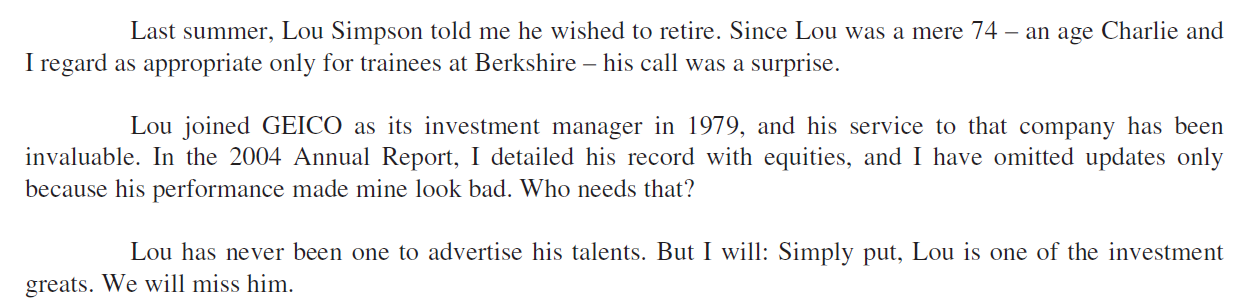
And then when he retired at the end of 2010, this is what Buffett wrote in the annual report:


Here is the history of Simpson's BAM holdings in the past year:

                    shares owned
6/30/2014:   3.8 million
9/30/2014:   4.0 million
12/31/2014: 4.5 million
3/31/2015:   6.8 million

This looks like the effect of a 3/2 split, but that didn't happen until May, so Simpson really bumped up his investment in BAM.

BAM now accounts for a whopping 12.5% of Simpson's portfolio, second only to his Valeant (VRX) position.  BAM is also bigger than his positions in BRK and WFC each of which constitute 11.5% of his portfolio. (It is interesting how Munger absolutely deplores VRX (he said it's worse than ITT in the 60's) while it's Simpson's top holding. This is why when people disagree with me, I don't care too much.  Even the best and the brightest don't agree on things.  Who am I to expect people to agree with me?!)

Anyway, this might have gotten some of your attention.   This also makes this post timely.

And by the way, this is Simpson's current portfolio (as of March 2015):

NAME OF ISSUERTITLE OF CLASS(x$1000)PRN AMTPRN
BERKSHIRE HATHAWAY INC DELCL A4,56821SH
BERKSHIRE HATHAWAY INC DELCL B NEW333,9272,313,799SH
BROOKFIELD ASSET MGMT INCCL A LTD VT SH364,9706,810,878SH
CROWN HOLDINGS INCCOM226,8044,198,521SH
LIBERTY GLOBAL PLCSHS CL C246,0154,939,071SH
ORACLE CORPCOM91,2162,113,921SH
PRECISION CASTPARTS CORPCOM283,9491,352,140SH
SCHWAB CHARLES CORP NEWCOM247,5668,132,923SH
UNITED PARCEL SERVICE INCCL B154,5441,594,226SH
US BANCORP DELCOM NEW249,1245,704,686SH
VALEANT PHARMACEUTICALS INTLCOM376,6461,898,540SH
WELLS FARGO & CO NEWCOM334,0576,140,747SH


Back to BAM
Here is the long term performance for BAM from their 2014 annual report:


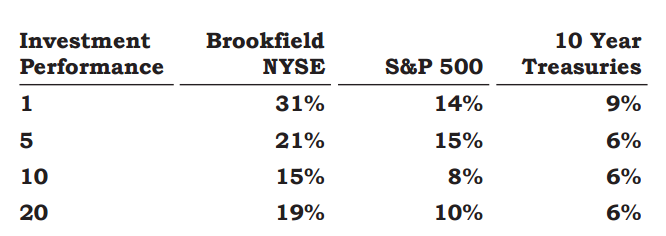
Pretty good, I think.

Presentation
There was an investor day back in September, 2014, so let's take a look at some slides from that presentation.  (Check out their website for their annual reports, presentations etc: BAM Investor relations)


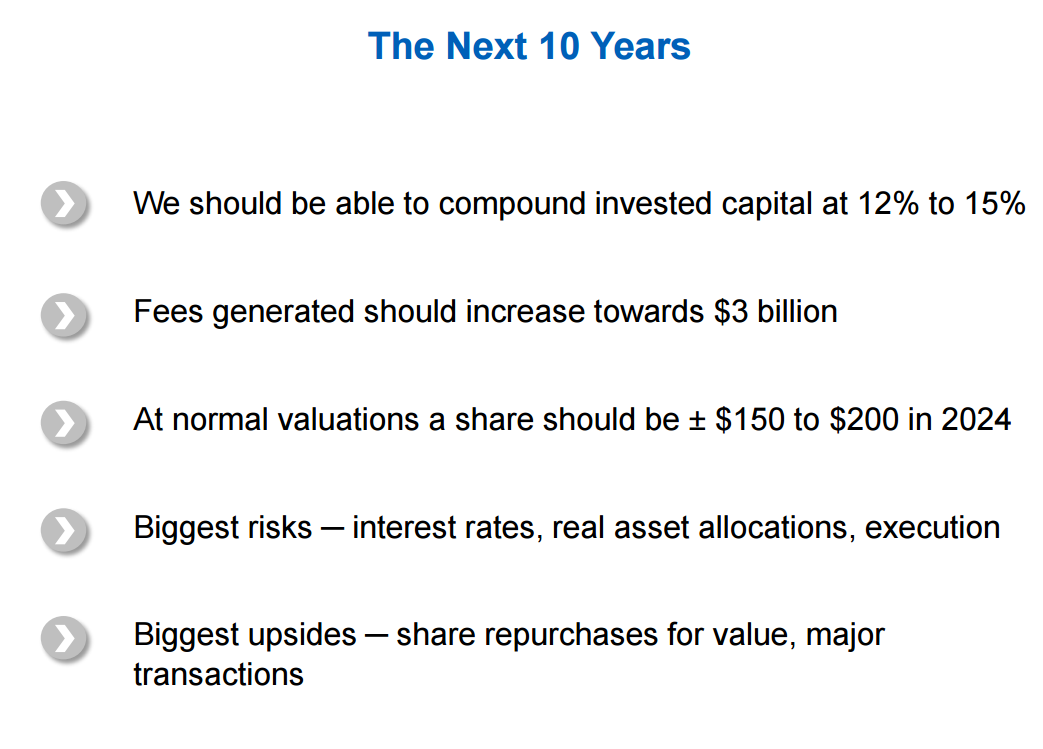
There was a 3/2 split in May of this year, so the above share price targets is actually $100 - 130, which corresponds to 12-15% annualized growth from the current price of around $36/share.

They have really diversified on many fronts; geographically, investment vehicles, asset classes etc.


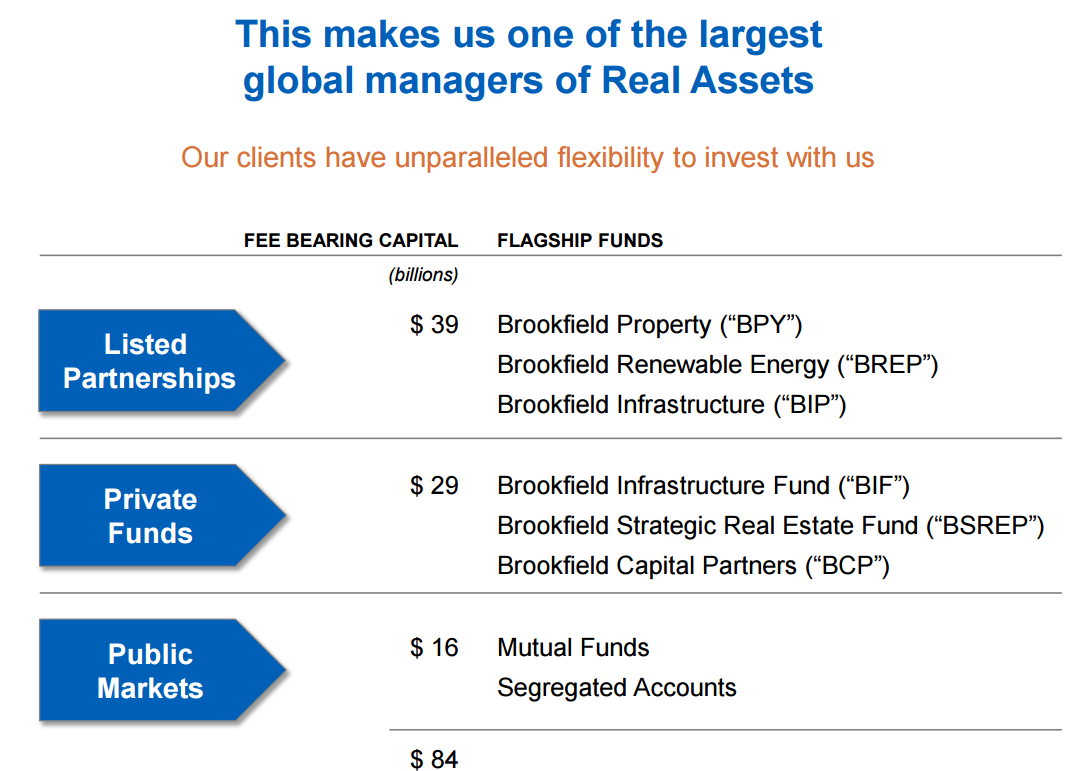
And the fact that they are in so many areas serves as a big advantage for them:


This is a section from their first quarter 2015 report that talks about their culture and why they think they can continue to do well going forward.  By the way, critics complain about the lack of disclosure at BAM, but I find their reports to be very informative.  How many companies write their quarterly reports almost like annual reports?  (in fact, BAM's quarterly reports are better and more thoroughly written and more informative than most annual reports!):

Culture as a Competitive Advantage 
We are often asked whether Brookfield can continue to increase the amount of capital we have invested in global opportunities, on a profitable basis. The short answer is that we believe we can. 
While acknowledging the normal challenges, we believe we have three distinct competitive advantages which will help us accomplish our goals:
  • Team Approach – The first advantage is that over the years, we have invested significant capital and human resources to build out the backbone and support structure of our operations, creating a first-in-class global company. Operating decisions are a culmination of the views of approximately 40 members of the management partnership, our 18 senior managing partners, our 700 investment executives and our more than 28,000 employees. We try to mix entrepreneurship, institutional stewardship, best-in-class professionalism, global scale and localized expertise; all with a focus on generating long-term capital appreciation. Our team approach to our business, the pursuit of excellence and commitment to our colleagues and investment partners drives this success.  
  • Our Global Reach – Brookfield’s second advantage is the scale and global reach of our operations, enabling us to invest in and manage assets and opportunities across many investment products and jurisdictions, efficiently and effectively. The flexibility to opportunistically invest capital in this manner is rarely possible with smaller firms. We have built a global company operating today in the major cities of the world including London, New York, Sydney, São Paulo, Toronto, Shanghai, Dubai and Mumbai and many other locations. We are diversified: culturally, financially and geographically. As an investor in our company you acquire exposure to global economic and business diversification which few other investments offer.
  • A Distinct Culture – The third advantage and possibly our most important is our distinct corporate culture. We have written extensively over the years on our first two advantages, but seldom have we attempted to explain “how” we operate and “why” we believe our culture provides us with an important competitive advantage. 
While admittedly it is difficult to define culture precisely (the Oxford Dictionary defines it as “the attitudes and behaviour characteristic of a particular group”), ours is based on the following key principles. 
  • Principles of Business – Our core fundamental business principles are set out in our annual report and were formed by our early founders, and refined over the years. These principles include: building our business and all our relationships based on integrity, value investing in how we allocate and invest capital, fair-sharing in our relationships and measuring success based on total return on capital over the long term. We are required to report quarterly, but regardless of short-term reported results, our investment focus is always on creating long-term sustainable appreciation on invested capital. 
  • Personal Financial Commitment – We promote long-term ownership stability and orderly management succession and encourage our senior executives to devote most of their financial resources to investing in Brookfield. As a result, collectively our management partnership owns approximately 20% of Brookfield, which is consistent with our efforts to align our interests with investors and clients throughout the organization. 
  • Operating as a Partnership – We operate internally as a “true partnership” with long-term investment horizons. Our management partners are highly specialized, but all recognize that by working collaboratively together as a team, we can achieve far more than if we were structured on a more traditional basis. 
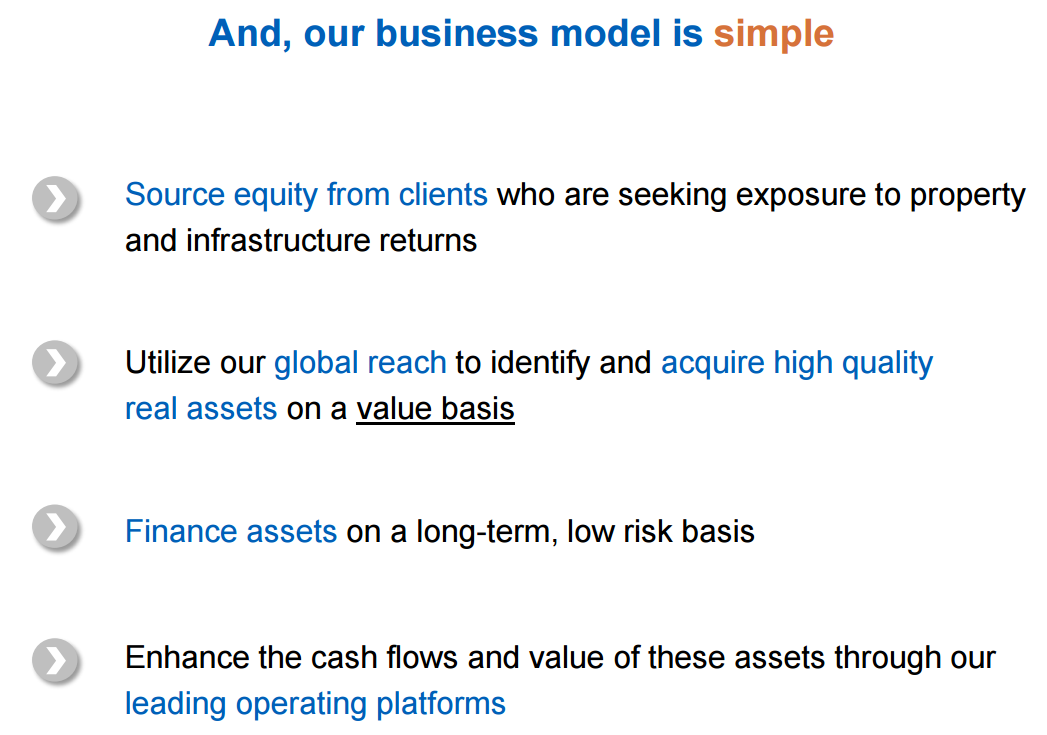
Our global platform enables us to finance and invest in a wide variety of opportunities, and few asset management firms offer as diverse a platform of specialized investment products. As we look forward to future decades, we believe that we are well positioned to build on our successes.  
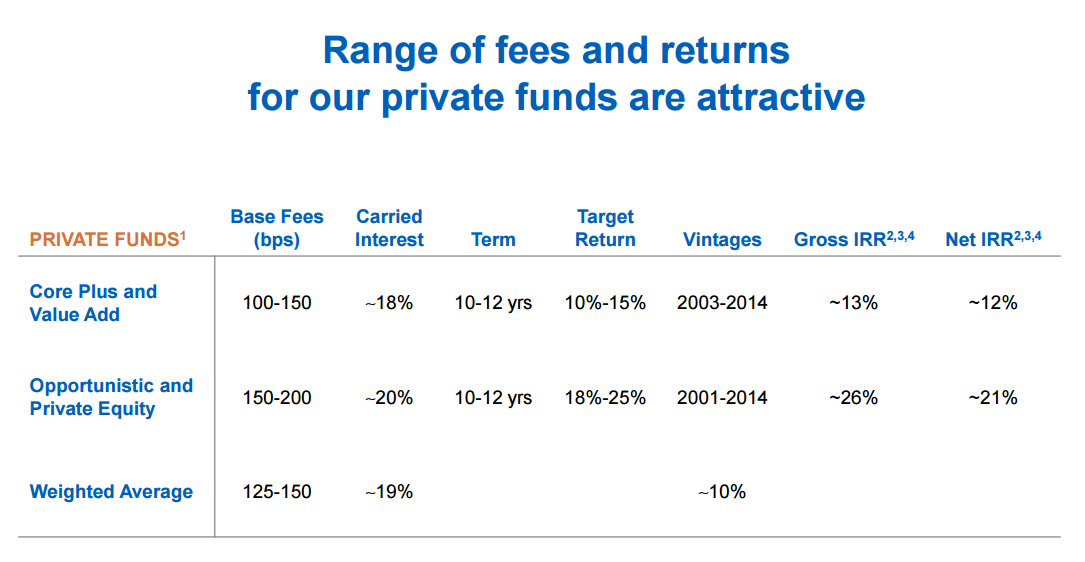
Asset Management
One of the big drivers in the value of BAM is their asset management business.  They have high quality assets on the balance sheet, and at the same time they raise more funds from outside investors and earn management / incentive fees and carried interest and this is really growing.  This is the key to the BAM investment.

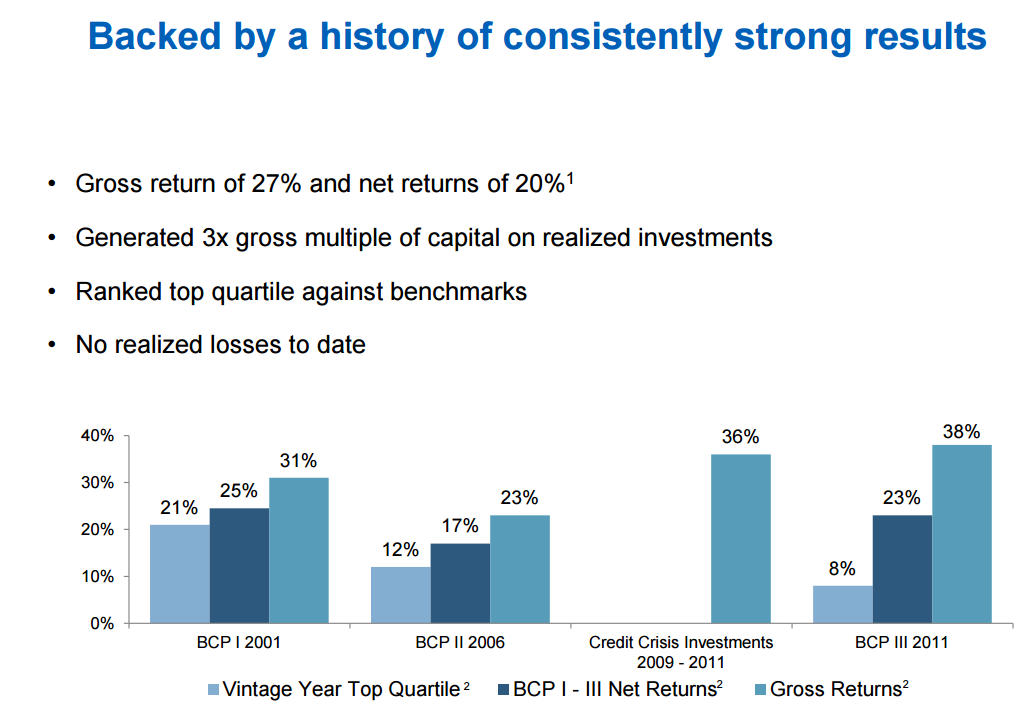
Importantly, they have performed very well so far:


One chart in the presentation is not so exciting.  They talk about the improving environment and then show this chart, but this is not so exciting for people who want to invest in a private equity manager; valuations are high now (so forward returns will be lower).  But then again, BAM is not doing conventional LBO's.


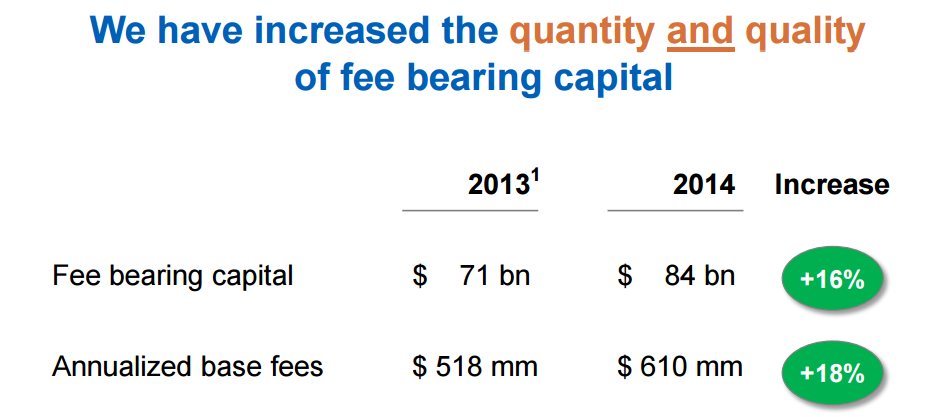
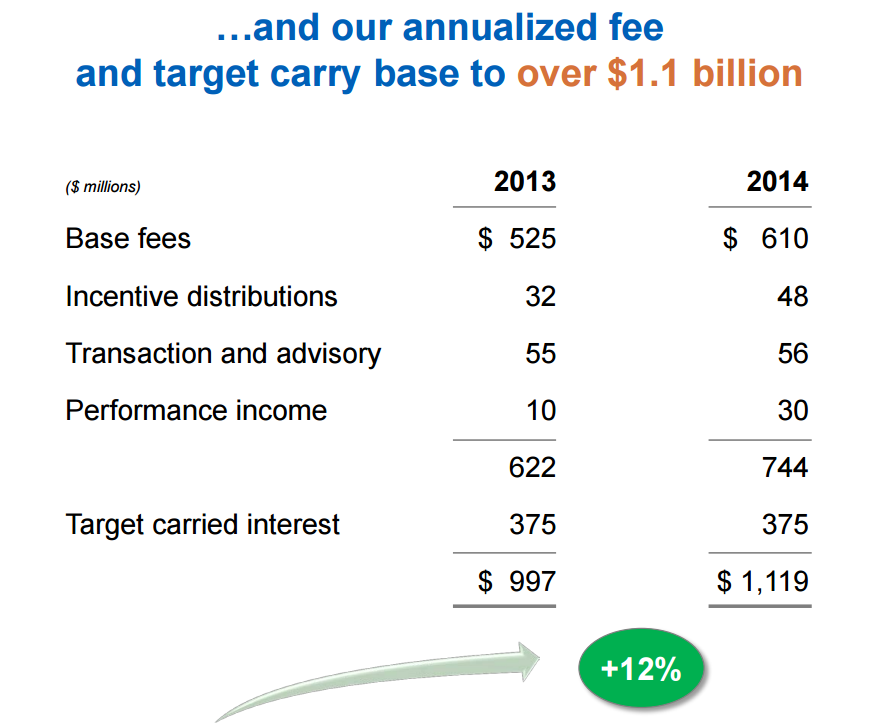
Their AUM continues to grow:


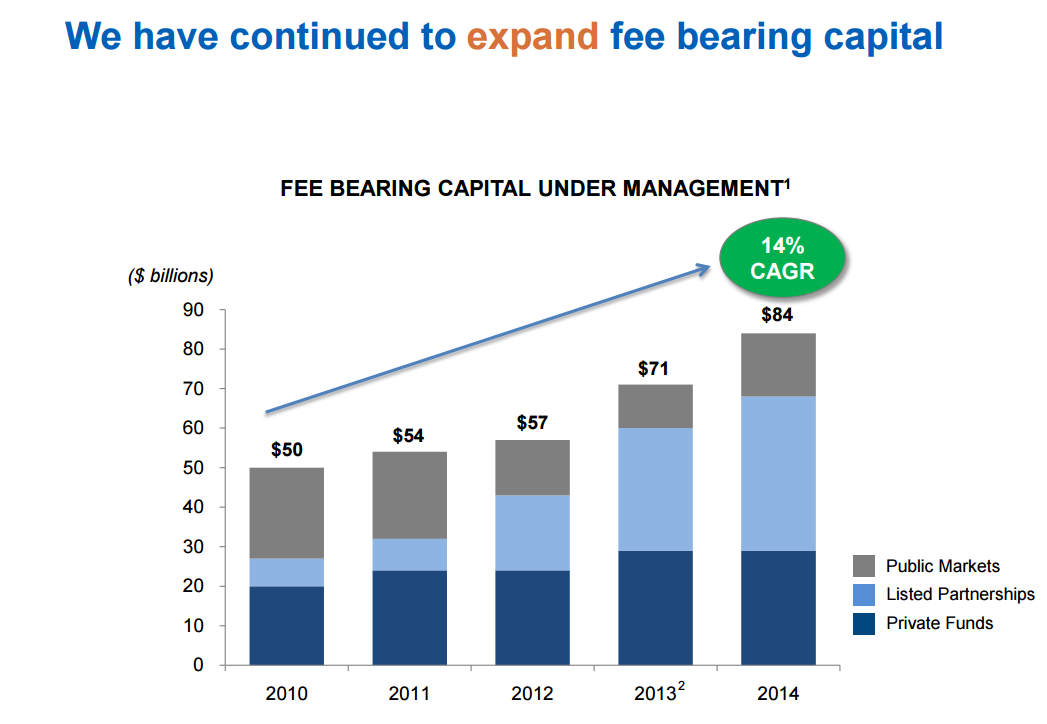
...and a big factor in this investment:


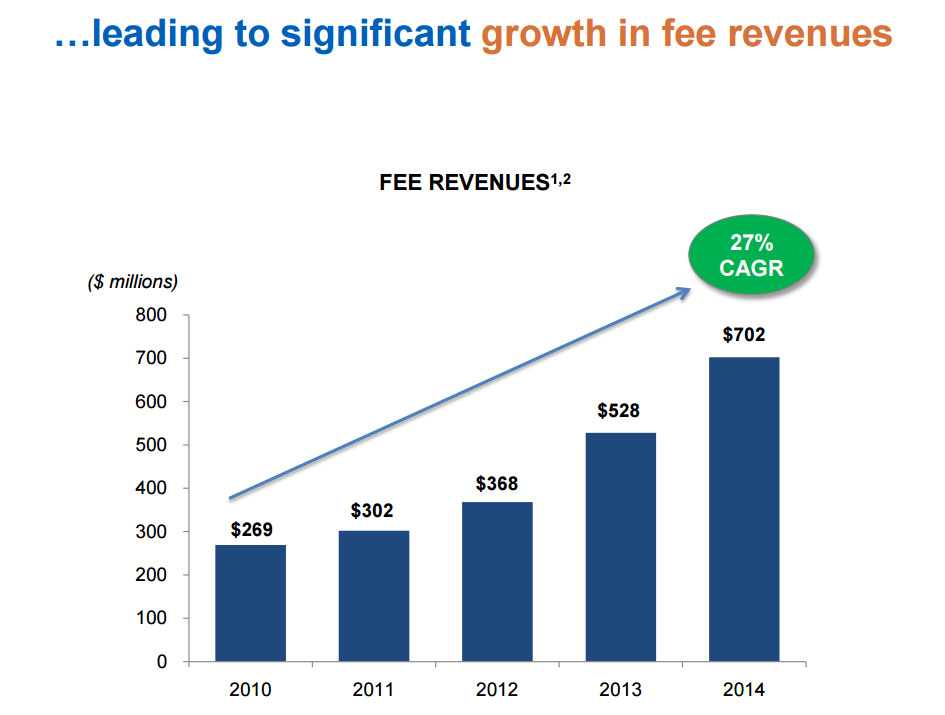
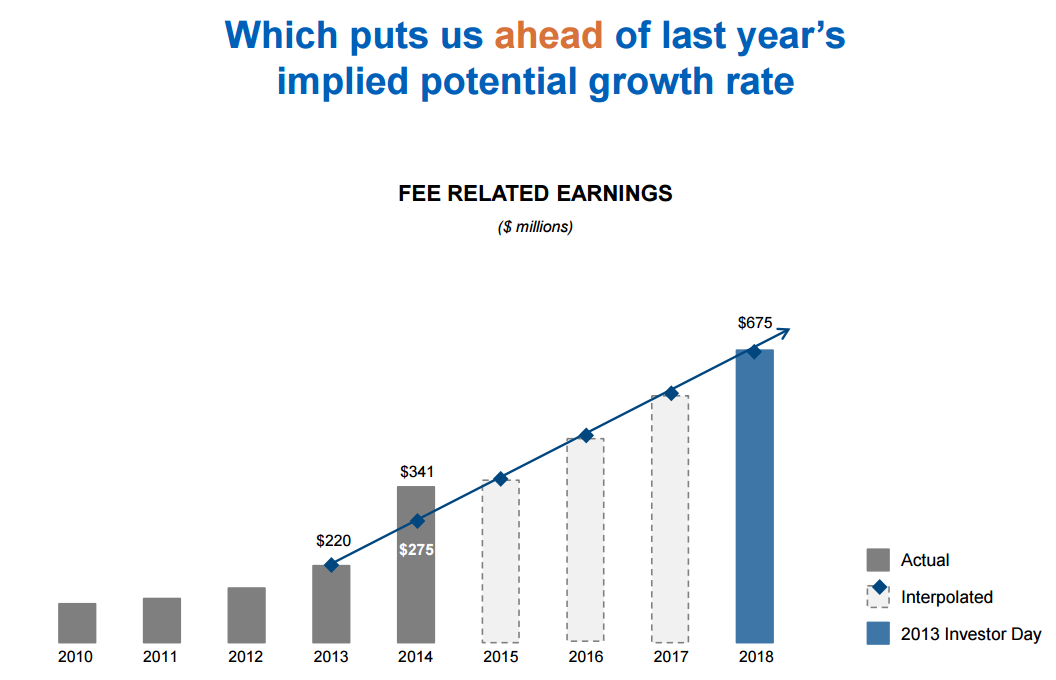
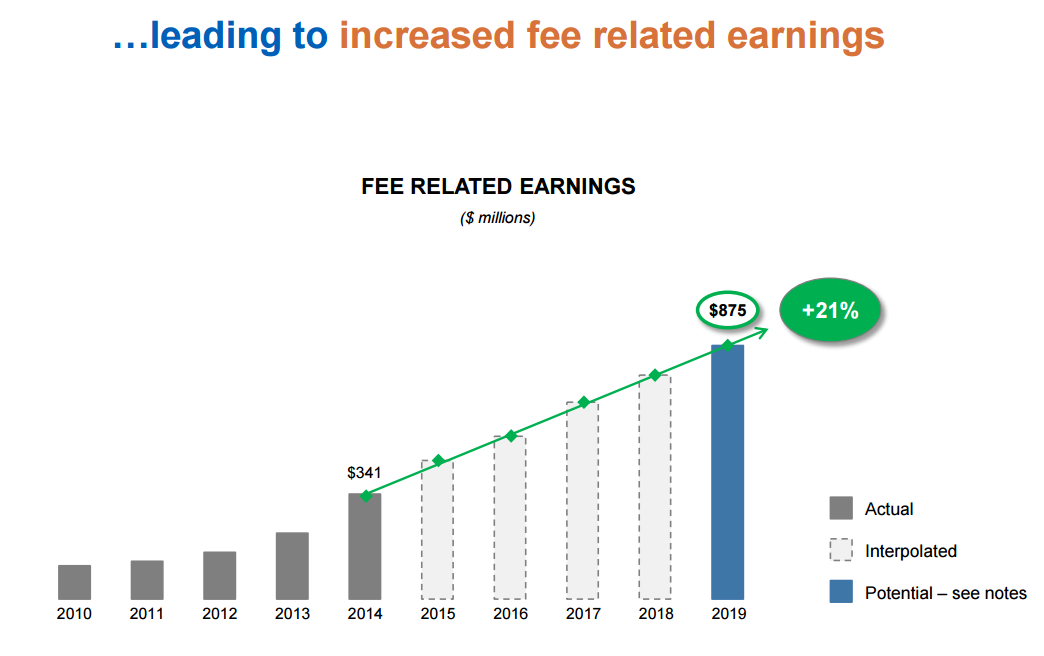
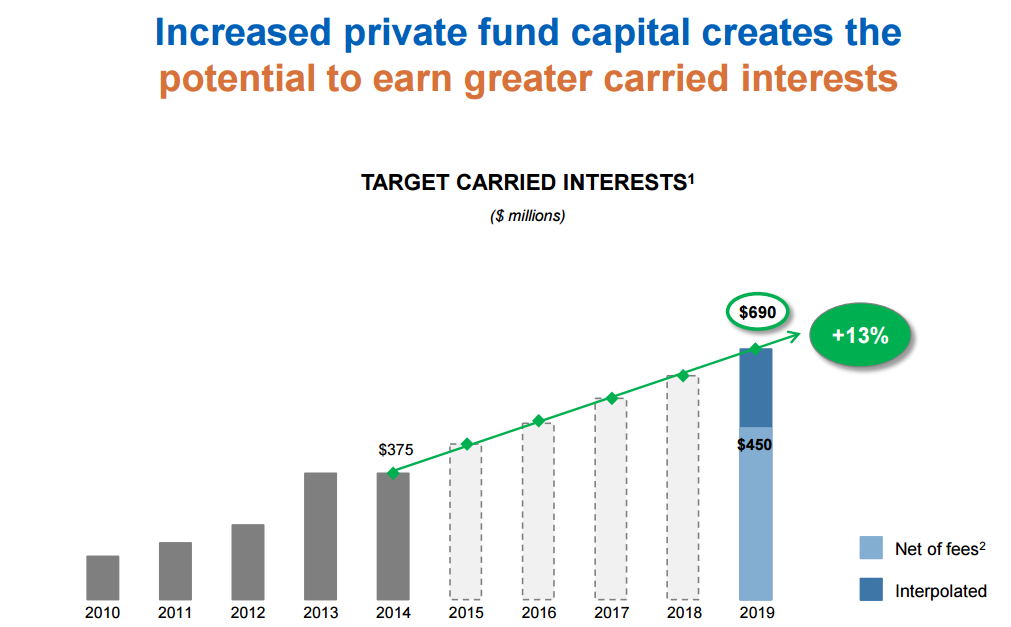
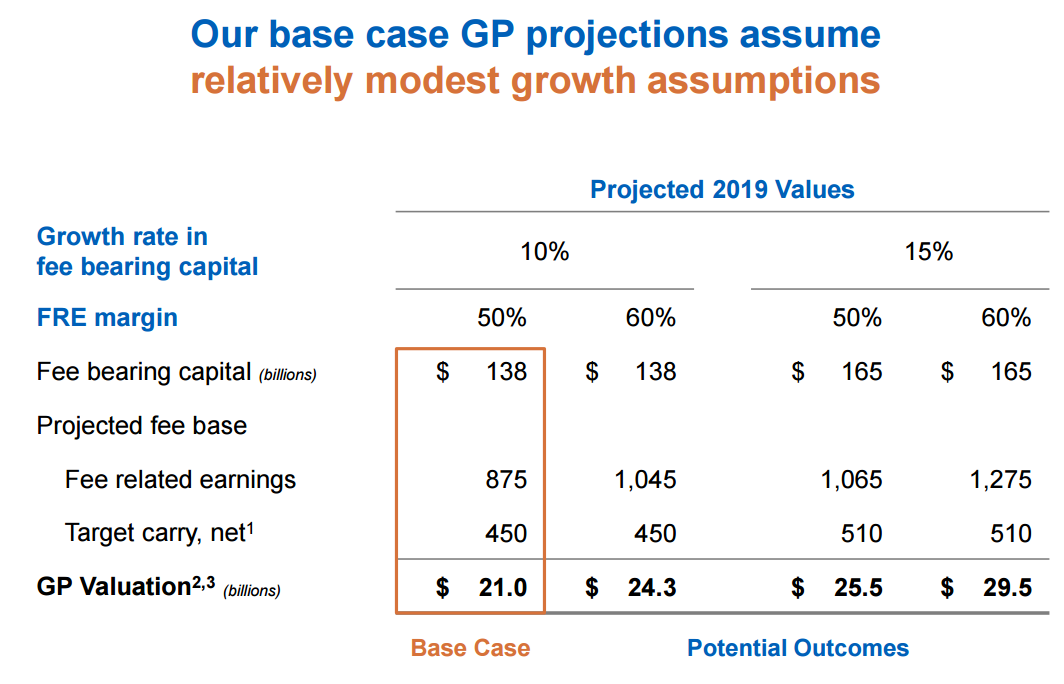
At the 2013 investor day, they said they plan to grow fee bearing assets at a 10%/year rate between 2013-2018.  Fee-related earnings was projected to grow +25%/year, target carried interest +18%/year and GP value (value of the asset management business) +20%/year from 2013-2018.


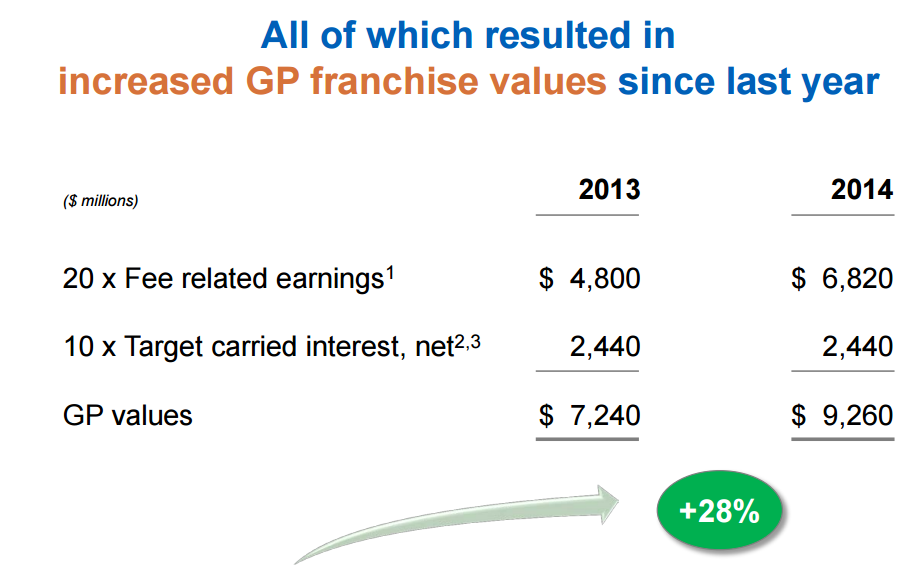
Their value of the asset management business (GP value) grew +28% last year.   With 983 million share outstanding at the end of March, 2015, this business is worth around $9.40/share.  This value is not reflected on the balance sheet, so adding this to the common equity per share of $19.70/share gets us to a full value of BAM of $29.10/share.   Common equity per share may be different from the LP value that BAM uses in presentations, but I used common equity per share as the LP value didn't seem to deduct some corporate things that I wasn't sure about.  Common equity per share, in that sense, might be a conservative look.

Big private equity firms seem to be trading these days at something closer to 10x earnings, so using that, BAM's GP value would be more like $6.00/share instead of $9.40/share.  Traditional asset managers used to typically trade at 20x P/E, but using 15x P/E would give a GP value of around $8.90/share.

These figures are pretax, though.  Many of the listed private equity funds do similar analysis with mostly pretax figures.  Since those are partnership units, taxes are paid by the LP unit-holders.  You can argue that the conventional asset managers who are valued at 15-20x earnings are valued on after-tax, net income, but the private equity folks will argue back that if those earnings are paid out to shareholders, shareholders would pay taxes on that too, so it is effectively pretax income if you compare it to owning LP units.   This is an interesting point.  If a corporation doesn't pay a lot of dividends, though, those reinvested earnings wouldn't be taxed at the personal shareholder level (until paid out later, or until capital gains are realized).

Anyway, BAM was trading between $34-38/share when Simpson added to his holdings in the first quarter.

BAM marks their assets to fair value in accordance with IFRS, and this value may differ from the publicly traded prices of the listed entities.  A reconciliation of this is shown in the quarterly report so you can make adjustments there.

Here it is:


Maybe BAM is worth a little bit more using market prices rather than IFRS fair value.

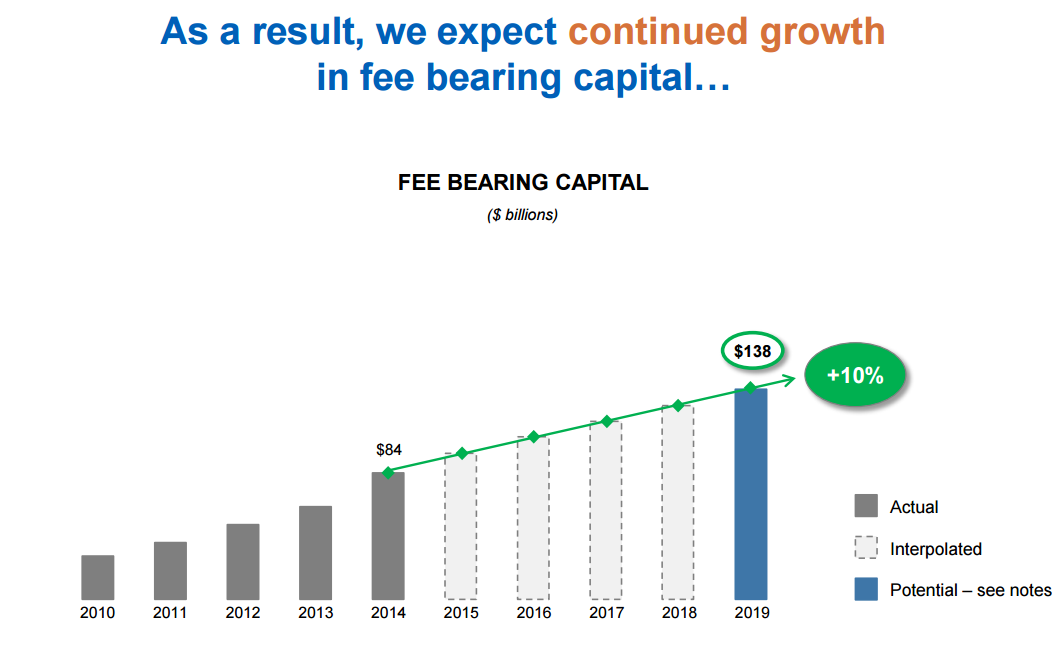
BAM expects to grow fee bearing capital 10%/year through 2019.


Using BAM's valuation, the asset management business could be worth more than $21/share by 2019.  At 10x earnings, it would be worth $13/share or so, and at 15x, $19.50/share.


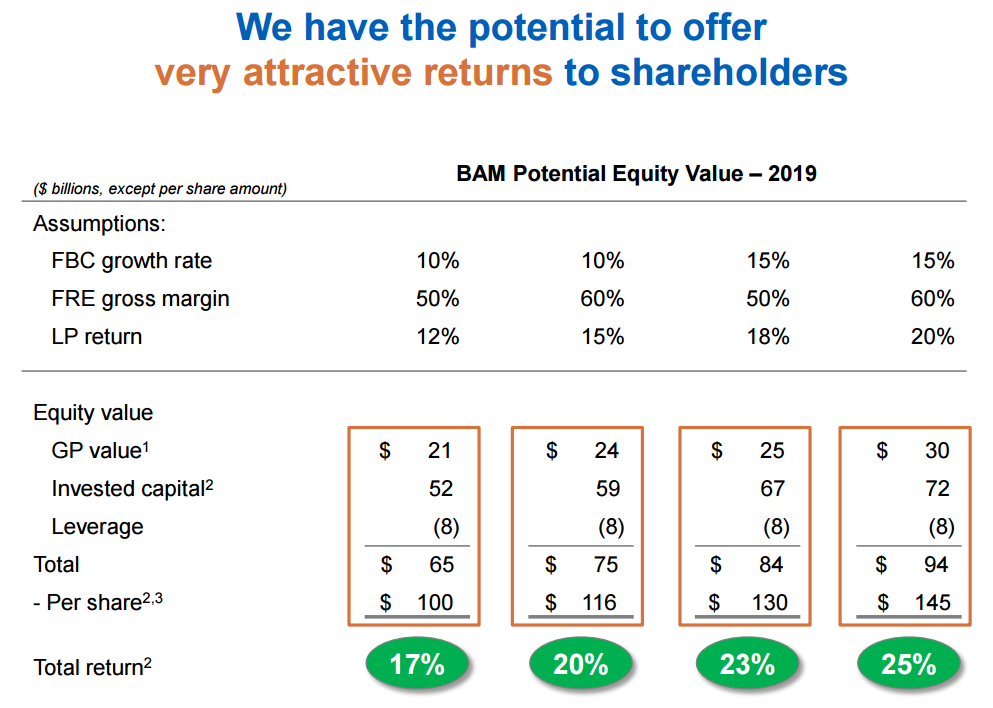
If BAM does better than the base case, it can be worth a lot more. The above per share figures are before the split, so after the split, the above per share values would be $67, $77, $87, and $97, versus the current $36/share.

IFRS Fair Market Valuation
There was some criticism of BAM because they switched to fair market accounting saying that a lot of the gains in recent years have been due to BAM just marking their positions up.  Also, there was a time that some listed entities were trading below where it is marked on the balance sheet; critics said that these positions had to be marked down.

But this isn't really a big issue.  BAM, before going to fair market value, used to show what they thought everything was worth in their reports and many investors looked at them.  Yes, there is some management judgement involved here.  But traditional book value has problems too.

What's good about BAM is that they show you how they derive their fair market valuations.

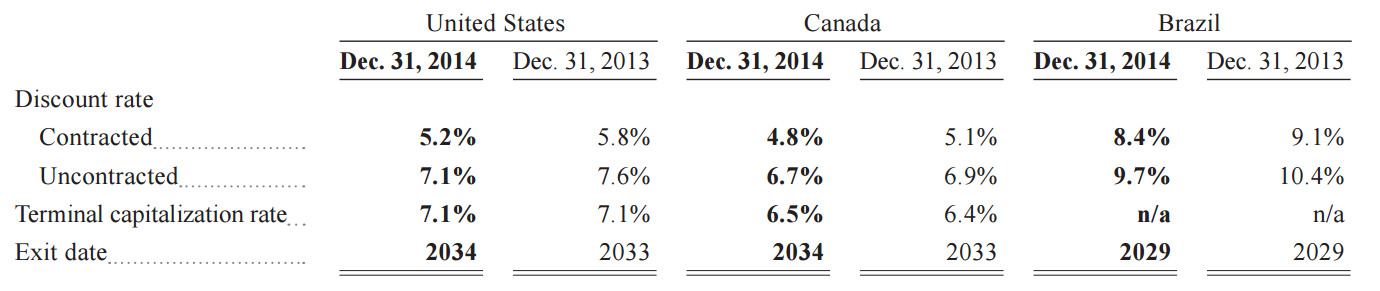
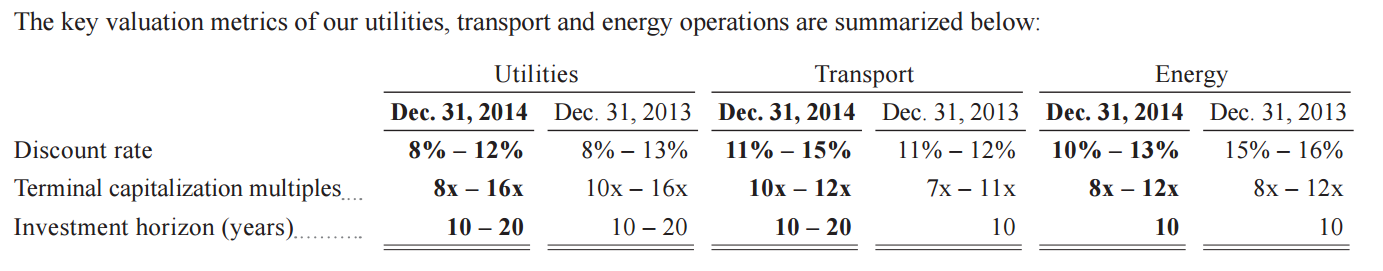
Just to make sure they aren't marking things up with 2% cap rates, look at the assumptions used.  You can find this in their reports.

You really can't tell if these discount and cap rates are fair without really knowing the properties, but you can see that they aren't all that low given 2.5% bond yields.  These look pretty, 'normal'.

Real estate

Renewable Energy

Infrastructure


Interest Rates
Pretty much everyone expects higher interest rates to come.  This will (if accompanied by a stronger economy) help banks and other financials, but it might hurt BAM.

I see BAM (the funds) as sort of more fixed income substitute than a substitute for equity.  People who have large fixed income portfolios tend to get into real estate, infrastructure, utility stocks and things like that; low volatility, steady-income-stream type investments.  I don't think people go, "gee, the stock market looks dear, I'm buying commercial real estate!".  It's more like, "gee, interest rates are too low... let's get into an infrastructure fund as stocks and hedge funds are too volatile for us...".

So in that sense, BAM is prone to a double-whammy.  Rising interest rates may push up cap rates (reducing values), and may slow the flow of funds into their funds (or even outflows).

This is true for stocks, too, to a certain extent, but I have shown in an earlier post that even if interest rates went back up to 6%, the stock market now wouldn't be out of line valuation-wise going back 30+ years.

I don't have that sort of confidence in this asset class.  Well, BAM is pretty diversified so it's not in any single asset class, but it is sort of the 'real asset' type stuff.

But even for real assets, as you can see from the above discount and cap rates that BAM uses, there is probably a big cushion against rising interest rates.

At the 2013 investor day, they showed a chart of cap rates against interest rates and showed that there is a substantial cushion between the two, just like I showed in stocks.

Check out this chart:

From 2013 investor day presentation

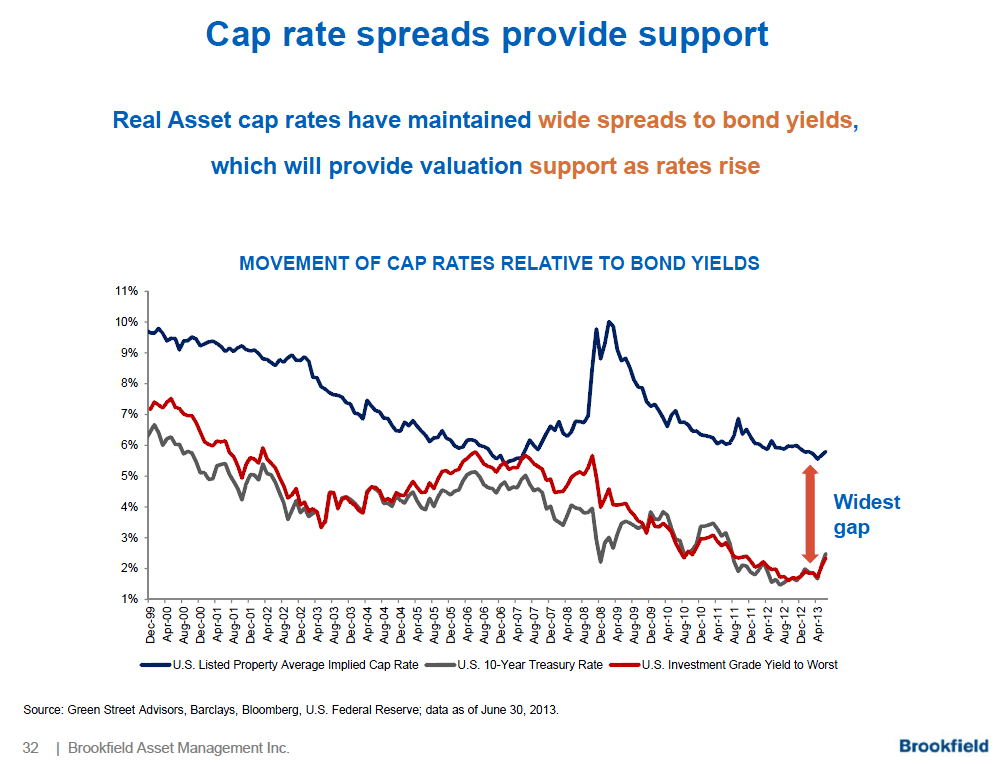
But that doesn't mean there won't be some upward pressure on cap rates when rates really start rising in a serious way.

The Good Part
On the other hand, Bruce Flatt has proven himself to be a very competent manager, and Lou Simpson seems to be buying into this in a big way (Murray Stahl has been a fan for a while too).  BAM is on the right side of all sorts of trends, whether it be capital moving to alternatives (CALPERS notwithstanding!), potential (or inevitable) inflation coming down the line due to Global PPP (so real assets == good), potential growth in emerging markets, pent up need for infrastructure invesments etc...

And this management seems to adjust to changing circumstances, so if you own BAM, you don't have to worry about this being a shoot-and-forget, static investment.  Even if your position in BAM doesn't change, you can be sure that BAM management will adjust to the ever-changing world; they are not inflexible, unadjusting automatons (like so many large companies seem to be)...


Wednesday, June 17, 2015

Quick Update on SuperPortfolios

In my previous post, I put a link to stock screens of Superinvestor stock holdings.  Initially, I just sloppily cut and paste out of a spreadsheet directly into the blogger and it was a mess.  So I redid it all and embedded spreadsheets instead.  It is now much easier to look through, and looks much better.

I also realize that a list of 1,000+ names is a bit much.  What are you going to do with it?  Well, all of the Dataroma Superinvestors are great investors, I think, so it's a good list to start with.

But at the same time, this is sort of a Buffett/value-leaning blog so I guess a lot of readers won't care for the more growthy names of the Tiger cubs, and maybe some of the holdings of the hedge fund types.

So I figured I would make a screen with a smaller universe.  Initially, I picked a bunch of the more traditional value guys and then my program crashed.  I don't know why it works well running the whole portfolio and crashes with a subset.

So to make it even simpler (and to debug), I just took the holdings of Berkshire Hathaway, Sequoia, Markel and SQ Advisors (Lou Simpson), and out came a nice list.

There are other worthy value managers, of course, in Dataroma.  I will eventually add the other value managers if I can get it to run without crashing.

But this short list was such a nice one that I decided to post it.  Take a look.

The original Superportfolio is the top link, and the one below, Small Portfolio, is the one that includes only stocks of the four managers named above.

SuperPortolio Stock Rankings
Small Portfolio

Looking at large, concentrated holdings and recent purchases is the best way to track managers and ideas, but sometimes manager favorites can be held for a long time and might get cheap even while they buy other stocks, so we might forget about them.  This sort of screening will make sure that we can see great ideas that might have gotten cheap.

These links are easily accessible by scrolling down on this blog and going to the "pages" section.


In Search of Value

So we have seen how the stock market is not really as bubbled up as it seems looking at it from 30,000 feet.  What are we to do, though?   What are we supposed to buy?  Where are we to look?

I mentioned that I would do a close-up look at the components of the S&P 500 index stocks like I did for the Dow 30 in my previous post.  I will do that.  I'll probably look at all of the major indices.

But a thought crossed my mind as I sat to figure out how to do the S&P 500 index.  It was a pain to go look for the 500 listed stock tickers, load it into a program and then run it without blowing anything up.  I know, I know, 500 stocks is nothing for computers these days.  You can tell I'm not really a computer person.

Screen Superinvestor Stocks!
I sorted/ranked Buffett's large stock holdings in my last post and it was an interesting thing to look at.  I never actually looked at it that way before and then a light bulb went off in my head.  What about doing that for all the great investors?  Go 'get' the holdings of all the great investors, scrape the financials on them and then rank/sort them.

A lot of us look at screens from time-to-time (or all the time for some), but I sort of get tired of screens because you get all the crappy stocks that you already know about and have no interest in show up all the time at the bottom of the barrel.

Many of us also spend a lot of time looking at the holdings of the investors we admire.

So by putting these two things together, we get a great screen; even the cheapest stocks are good enough, or there is something there, for a Superinvestor to own it.  So in that sense, the Superportfolio is pre-screened by the best investors.

And there is a great resource for this sort of thing.

Most of you readers know Dataroma.  It's a great website that tracks the holdings of what they call the Superinvestors.

I accumulated all the holdings of the Superinvestors listed there and was surprised to learn that collectively, they own more than 1,000 stocks (excluding duplicate holdings).

I took that Superportfolio and then did what I did yesterday; got the financial information and then ranked them according to various measures.

Here are the results of that:

Superinvestor Stock Rankings

I initially posted a crude version of this, just cutting and pasting off of a spreadsheet and it looked really awful, so I redid this and embedded an actual spreadsheet.  This is much easier to deal with and looks much better.

Anyway, this is sort of a different kind of post than I usually do, and I know it will be worthless to many who don't like long lists (what the heck am I supposed to do with that?!).  And others that love lists may enjoy it.

Either way, judging from the output from these screens, whatever we think about the stock market, I think there is a lot of work to be done.


Some Notes
Some names were left out.  Stocks with ticker symbols with a dash were left out as my program ran it with periods (BRK.B instead of BRK/B).  I can fix that for future runs, but there weren't that many names anyway so it's not a big deal and it wasn't worth redoing today. Also, if the data was missing, the name is not on the list.  For example, if a name didn't have an EV/EBITDA number (showed NA), it is not on the EV/EBITDA list.

Also, keep in mind that these are investments of the Superinvestors so these ranks may not mean as much.  Many Superinvestors look at and buy stuff based off of things that don't screen well (hidden assets, adjusted free cash, normalized earnings, understated earnings, events etc).

Tuesday, June 16, 2015

In Search of a Stock Market Bubble

So, (the sentence starts with "so" because this is a sort of ongoing discussion that's been going on here for years) I've been thinking about the overall market again.  Despite my telling people to ignore this and ignore that, I can't help it; sometimes I think about this stuff.  Well, it's OK to think about it as long as it doesn't lead to irrational decisions.

Anyway, as usual, there is a lot of talk of the market being insanely overvalued, median P/E's at post war records and all the usual.

I look at the charts and some are scary, but I still don't get the sense of a bubble.  I've seen the Japan bubble in 1989, the 2000 internet bubble and some others.  I see the Chinese bubble going on right now.  But I still don't really get the sense that the U.S. stock market is in a bubble.  Yes, there is a pocket of bubbliness, like in some parts of the tech sector (social networks, biotech etc.), but overall I just really don't see it.

Like Black Monday?
Also, there were comments to the effect that 2015 feels just like 1987 before Black Monday because interest rates spiked up right before the stock market crash.  Well, back then the stock market was at 20x P/E and bond yields spiked up to 10%.  So that was a Fed model yield gap of a whopping 5% (earnings yield of 5% versus bond yield of 10%).

Today, we are talking about interest rates spiking up to 2.5% with the P/E ratio under 20.  So in that sense, there is no stretched rubber band ready to snap based on interest rates.  And I showed in recent posts that the market is fine with interest rates spiking up to 6% (of course there will volatility based on that, though).

Nifty Fifty 1972
I made a post just like this one two or threes years ago when people were saying the market is overvalued.  I looked up the P/E ratios of the Nifty Fifty stocks in 1972 to see what a real bubble looks like.

Here is what you were dealing with if you were investing in blue chip stocks back in 1972:


What is really interesting to me here is that the S&P 500 index P/E ratio at the time was 19.2x.  But look at the nifty fifty P/E ratios.  To me, this is what a bubble looks like.  These 'ordinary' companies were trading at higher P/E's than high growth social network stocks or fast casual restaurant chain today!

So, while everyone focuses on the big scary charts of market P/E ratios and whatnot, let's just look under the hood and see what's actually going on.

To be totally neutral, I just picked the Dow 30 stocks.  They are large caps, representative of major U.S. companies.  Despite the horrible structure of the index (price-weighted), it does correlate pretty closely with the S&P 500 index.  I plan on looking at the S&P 500 index in the same way in the near future.

Dow Jones Industrial Average Component Valuations


I just scraped this data off of Yahoo Finance.   I ranked it from cheapest up based on forward P/Es.

It's sometimes a good idea, when trying to figure something out, to invert.  To get comfortable being long something, let's see what it would feel like to be short it instead (just because it's not a good short doesn't automatically make it a good long, though).

People say that the market is tremendously overvalued.  Is the market so overvalued that I would be comfortable with a massive short position?  I just imagine myself with a big short position to see how I would feel.  What do I need to make money?  What can go wrong?  Is there really a big margin of safety in terms of valuation; are things so overvalued that it's a no brainer to be short?  At this point, I would not be comfortable short at all.  Sure, earnings for everyone might be bloated due to QE-infinity and budget deficits.  There are other reasons to be bearish, but I just don't see it from a valuation point of view.  The market is certainly not cheap.  But it's not so expensive that it's a no-brainer short either.

It's true that many of the Nifty Fifty were the growth stocks of the day.  So shorting those back then may not have been any easier than shorting Facebook or Amazon today.  In that sense, this is not really apples to apples.  I'm comparing the Nifty Fifty of 1972 to the Dow 30 stocks now; not fair.

Here, by the way, is the list of Dow 30 stocks as of 1976 from the Dow Jones website (they didn't have 1972, but I assume it hasn't changed much):


But anyway, if you look slowly through the current Dow stocks, which ones are really overvalued?  I mean overvalued in a bubblistic sense?  I don't want to comment on each one, but most look pretty reasonable to me.  Most of the high P/E stocks (NKE, DIS, V, KO etc.) seem to be stocks that always had high P/Es, so don't feel like bloated P/Es based on a bubble.  Many others are just totally reasonable and some are really cheap (AXP, for example.  It has a close to 30% ROE, 12-15% long term EPS growth target, and it's trading at less than 14x P/E and less than 10x pretax earnings per share!).

Let's say you think the market should go down 50%.  I remember reading a comment by a hedge fund manager who said that he likes to buy stocks where if you doubled the price it would still be cheap and short stocks that if you cut the price in half, it would still be expensive.  That's quite a margin of safety built in!

If you look at the Dow stocks above, do I really think that the fair value of each of those is half the current P/E ratio?  I would say no to most of them.  OK, margins are bloated.  But just finger through the list slowly from the top to bottom.  Which ones are over-earning with bloated, bubbled up margins?  Honestly, I don't know.  Nothing jumps out at me as a candidate.  Readers here know that I am not a big long term fan of Apple as an investment, so I would argue that AAPL would be an example of possibly bloated, long-term unsustainable margins (and I know, I know, a lot of people don't agree with me on that and that's OK!).

But otherwise, it seems like a lot of them are actually under-earning.

Berkshire Stocks
As another 'sample', let's just look at BRK's portfolio, which in aggregate is down on the year so far.


Berkshire Hathaway Large Stockholdings Valuations


Here too, I come to a similar conclusion as the above (well, there are overlaps).  Nothing jumps out at me as needing a 'crash' or big bear market to correct.  I don't really see a stretched rubber band here either.  Most seem to be under-earning and I don't really see any unsustainably high margins.

Buffett Dogs Strategy?
So, looking at this, it's interesting to see that there are three stocks down a lot this year.  WMT, PG, and AXP are down -16%, -14% and -15% year-to-date respectively.  And as I said above, AXP has incredible margins and ROE and is trading under 14x P/E.  I know there are worries about competition; alternative payment systems (Munger said there is more competition now than before, but it's still a great business).  And the loss of Costco is certainly weighing on the stock.  This will cause earnings to be flat, but AXP expects EPS to start growing 12-15% again in 2017.

Conclusion
I've been saying this sort of thing since 2011 when I first started this blog; that the market is fine.  But sooner or later the bull market will end.  The market will tank and people will go back and read these posts and have a good laugh.  I know that will happen for sure.  But that's OK.

I'm not trying to predict anything, nor am I saying that we won't have another bear market again.  The market will go down for sure, 50% or more.  There is no doubt about that at all.  But I don't know when that will happen.

I am just looking at a bunch of facts to see what's actually going on.  Sometimes, it's hard to see what is happening just looking at big, macro charts; they can be misleading, like flying over a disaster zone in an airplane.  Sometimes you have to get on the ground and walk around to see for yourself.

Tuesday, June 2, 2015

Jamie Dimon for Dummies


Oops, I did it again.  When I made the Missing Manual cover for Berkshire Hathaway, I told myself that it would be the last time I would do that.  Things like that can be fun the first time but can get pretty old pretty fast.

But, sorry, I couldn't resist this time.

When the news hit that 38% of shareholders voted against Dimon's compensation plan, I was stunned.  I was like, "What the...".

I didn't actually read the proxy firm reports so I don't know what it's all about, but I was surprised.   Then Dimon gets quoted calling investors "lazy" for voting according to proxy advisory firm recommendations.  After that, the press jumps in and calls Dimon "arrogant", even after all the trouble his bank caused.

That was enough, I had to make a post.  And this is not a Rahodeb sequel (John Mackey, CEO of Whole Foods posting anonymously on a message board); This is not Jamie Dimon posting anonymously (grammer, for one, would be much better).

Dimon is Underpaid
Just in case some were too lazy to read the proxy, here are some interesting charts from it.  I found it to be a pretty good proxy compared to many others with minimal explanation of CEO compensation.

Readers here know this because I post this chart all the time, but JPM has been an amazing performer since Dimon came on board.  The stock price has also performed very well since the 2007 peak.


...and for this great performance, Dimon gets paid less than any of the other large financial company CEO's.


...and over time CEO compensation has reflected performance.  I didn't necessarily agree with the pay cut in 2012 due to the whale trade.  JPM still made a lot of money that year.  I believe in paying for performance, and if the total performance was good, so should the pay.  If you run a fund and perform very, very well, you don't get a pay cut just because you made a mistake and one of your holdings went to zero.  That loss is already in the performance number.  I think the 2012 pay cut was driven (unfairly) by optics; the board had to do something to show that they were punishing Dimon for making such a stupid mistake.  To me, that was totally unnecessary.   But I admit there might have been some political value in doing that to appease someone.

Many CEO's make much larger mistakes and get paid more.


Proxy Advisory Nonsense
I don't read reports written by proxy advisory firms, so I can only guess, but it seems like they try to create some ideal model and cram everything into the model without much thought.  One of them a few years ago criticized the Berkshire Hathaway board saying that they lacked independence.  It's true that all the board members of Berkshire Hathaway are good friends of Buffett.  But if the Berkshire board is not acceptable to someone, then they just don't understand Berkshire Hathaway.

In general, I suppose the proxy advisories are right; the board has to be independent.  But for the companies I usually follow, if the CEO needs to be supervised by an independent board, then I don't want to be invested in that company.  This is not the best way to look at things from an academic, corporate governance point of view.  But that's the way I see it, particularly in the cases where I am invested because I like the CEO (in that case, I want him to have more power!).

But anyway, going back to proxy advisory firms, I really don't understand the business. If you are a professional investor, why would you depend on some outside advisory firm to tell you how to vote?  Do they not read the annual reports and proxy statements?  Are they too difficult to understand that you need advice from the outside?  I don't get it.  Maybe they own too many stocks (hundreds) that they can't keep track of each one so they need advice.  Maybe they are index funds.  There must be some history here that makes sense but frankly, I have never really given it much thought.

Dimon is Arrogant?
And then there is this backlash that after causing all this trouble, paying out $20 billion in fines and being charged with a felony (as a firm), bankers are still as arrogant as ever.  Well, first of all, if anyone has followed the crisis closely, JPM was one of the good actors.  Sure, they may have made some bad loans, even bad subprime loans.

But JPM stayed out of a lot of the problem areas (SIVs) and remained profitable throughout the crisis, not losing money in any single quarter.  When the financial industry was on the ropes, JPM stepped in to buy Bear Stearns and Wamu.

JPM got screwed on those deals, because most of the fines that JPM has paid since then have been for things that those two firms did in the past (which was not supposed to happen).

Most people (I notice this from personal conversations with a lot of people too) still look at the banking industry as one large entity, each bank as evil as the other.  To most people, there are no good banks and bad banks.  All banks are bad.  In fact, around here, most people think all big businesses are evil, bank or not.   (This is the sort of simplification/generalization that I think is really harmful, like all Muslims are evil etc.).

Individual Prosecutions
And by the way, about these Wall Street violations; a retiring prosecutor said on CNBC the other day that one thing he said he would do differently is to go after individuals instead of firms.  When the government goes after companies, the shareholders pay a big fine and the violators get off scot free  (actually, those most directly involved are probably fired.  But yes, they are free).

Frankly, I don't understand forcing banks to plead guilty to felonies in the recent foreign exchange case.   I think the dealers that were involved should be charged and put in jail, just like for violators of insider trading.  No big bank has ever been charged with insider trading (well, at least I don't remember any cases), but there have been employees caught insider trading and put in jail.  Those cases were clear cut, perhaps because they were done for individual gain and not for the gain of the company so it was obvious that the banks had nothing to do with it.

I think if employees were put in jail for violations, this would work better for reducing problems.  Nobody wants to go to jail.  I am still shocked at the amount of insider trading that was done in the hedge fund world recently, though.  I joined the business after the 1980's scandals, so my generation was terrified of getting caught insider trading.

If a Walmart employee beat up an annoying customer, that employee would probably go to jail.  Walmart would not be charged, unless it was proven that Walmart management encouraged such behavior, or maybe that management was negligent in hiring a dangerous person or something like that.  Why should a whole company or CEO be charged for things that some employees do?  If you own a cab company, no matter how good you are, some of your drivers are going to speed. Some of them are going to park illegally.  Some will talk on the cell phone while driving and crash.

Anyway, this is an interesting topic but beyond this single post.

Digression
And by the way, last month I put up a chart comparing stock P/E ratios to interest rates.  And then I showed the range of P/E ratios when interest rates were in certain ranges.  I was too lazy to actually put bands around the regression line since it's not a 'one button' option in Excel.

But I did eventually put bands around the regression line so I thought I'd put it up here.  It doesn't really change the conclusion very much, of course.

This is data from 1980 - 2014.  The data seems cherry-picked for an expensive time, but including data after 2007 and before 1980 would show that interest rates are even less meaningful (lower R2 etc.).  Since we are trying to figure out what higher interest rates would do to the market, it's fine.


Those red squares don't mean anything. they are just the end points of the upper band.

And here is the table of the respective lines (the regression was y = 0.8367x - 0.1 with an R2 of 0.77):


IR
P/E
-1std
+1std
-2std
+2std
1135.748.930.0
263.634.7379.724.0
341.526.990.920.0
430.821.951.617.1154.6
524.518.536.115.067.4
620.316.127.713.343.1
717.414.222.512.031.7
815.212.718.910.925.0
913.511.416.310.020.7
1012.110.414.49.217.6
1111.09.612.88.515.4
1210.18.911.68.013.6
139.38.310.67.512.2
148.67.79.77.011.1
158.07.39.06.610.2

The regression line shows that at an interest rate of 6%, the P/E ratio of the market is 20.3x.  The 1 std range around that is 16.1x - 27.7x.

I know there are arguments that margins are too high, that absolute valuations are more important than relative etc.

But what I am trying to show is simply that there is no reason to think that markets must go down just because interest rates back up some.  There will be some short term volatility, of course, as people adjust their portfolios.  If interest rates go up a lot, of course, the stock market can go down a lot too.

Valuation Fallacy
I think there is sort of a fallacy when looking at long term valuation charts.  People point to 1929 and 2000 and go, wow, every time the market gets over 20x P/E, there is a big bear market. And look, every time the market trades at 7x P/E ratio, a huge bull market follows.  And people conclude that a market with a 20+ P/E ratio must be followed by a bear market (in short order), and the best time to buy stocks is when the market is trading at 7x P/E ratio.

Well, buying only when the P/E ratio is at 7x and not owning stocks when the market is over 20x wouldn't have resulted, I don't think, in good performance over the long term.

This reminds me of that bank robber and gun fallacy; just because all bank robbers have guns doesn't mean that all gun-owners are bank robbers.

So What to Buy?
A couple of years ago, I said that Buffett would keep buying Wells Fargo up to 10x pretax earnings (see post here: Wells Fargo is Cheap!).   I said he would be buying it up to $50/share back then (the stock was at $35).

Updating this figure, WFC earned $6.00/share or so in pretax earnings in 2014.  So Buffett would keep buying WFC up to $60/share.   Keep in mind that this is not intrinsic value, but what Buffett would gladly pay for the business  (and sure enough, he bought more shares in the first quarter of 2015).

For JPM, using the same metric, Buffett would gladly pay $74/share; JPM earned $7.40/share in pretax earnings in 2014.

So this is not some valuation that is adjusted up for interest rates or anything like that.  I showed that Buffett often pays 10x pretax earnings even for listed stocks (and not just private businesses), and this has occurred over decades.

These are stocks you can buy now that Buffett has proven to be comfortable with at price levels that are consistent with Buffett's valuation levels that goes back a long time.

And these banks, I don't think, have unnaturally high and unsustainable margins (what many feel about the stock market overall).  In fact, banks seem to be underearning due to the still subdued housing market and more importantly, the unnaturally low interest rates.  So there you go; an actionable idea to go along with this long opinion piece.


Conclusion
Jamie Dimon is a great CEO and is massively, ridiculously and obscenely underpaid.   And you can have him work for you at a reasonable valuation too!